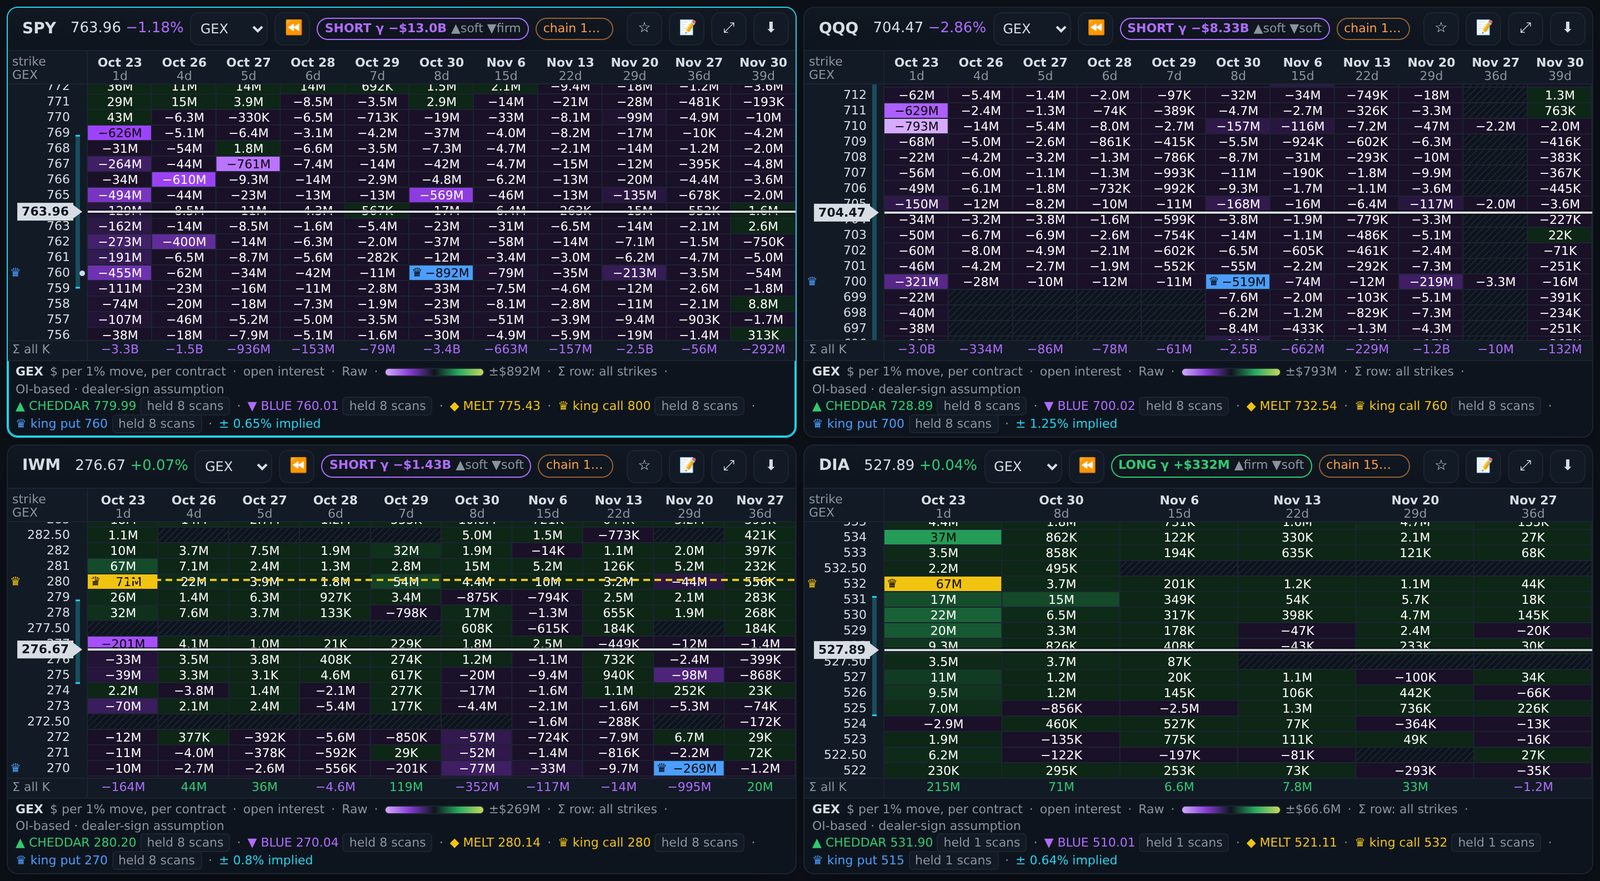
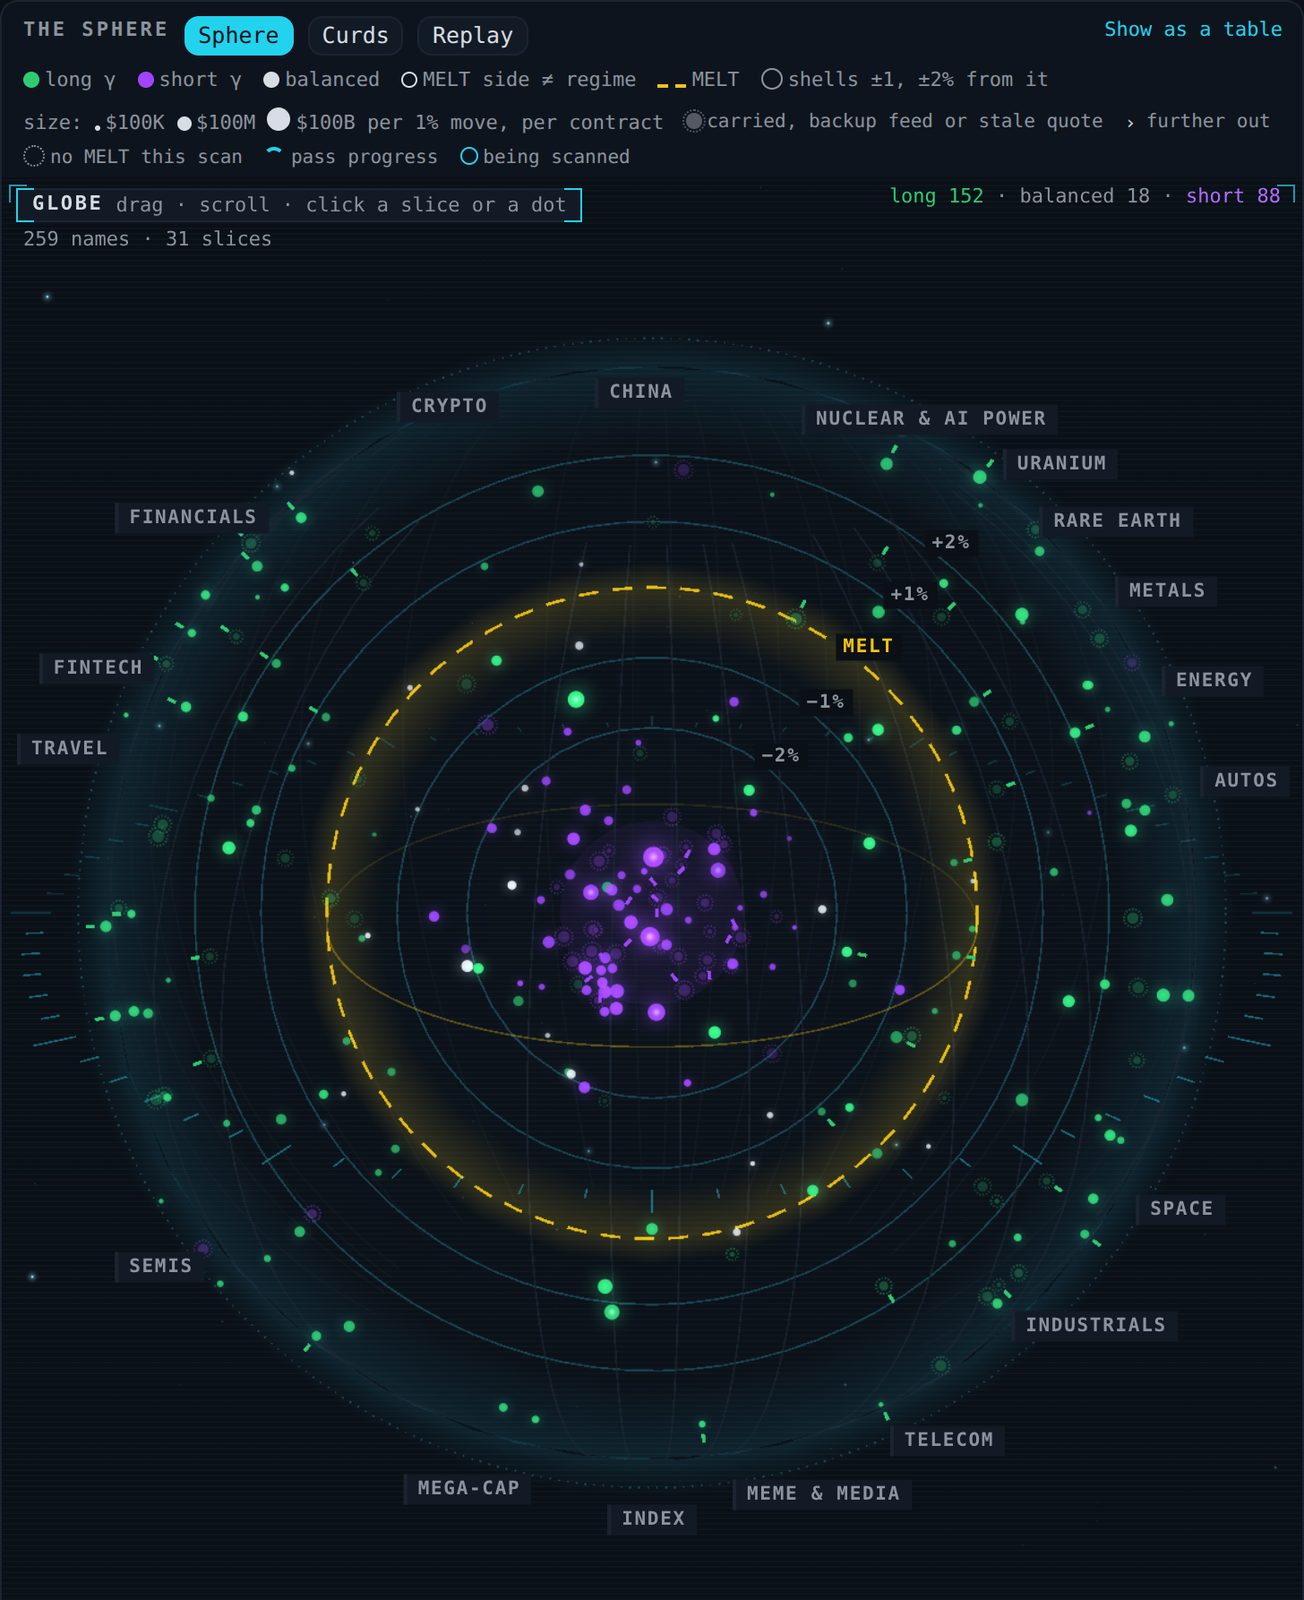
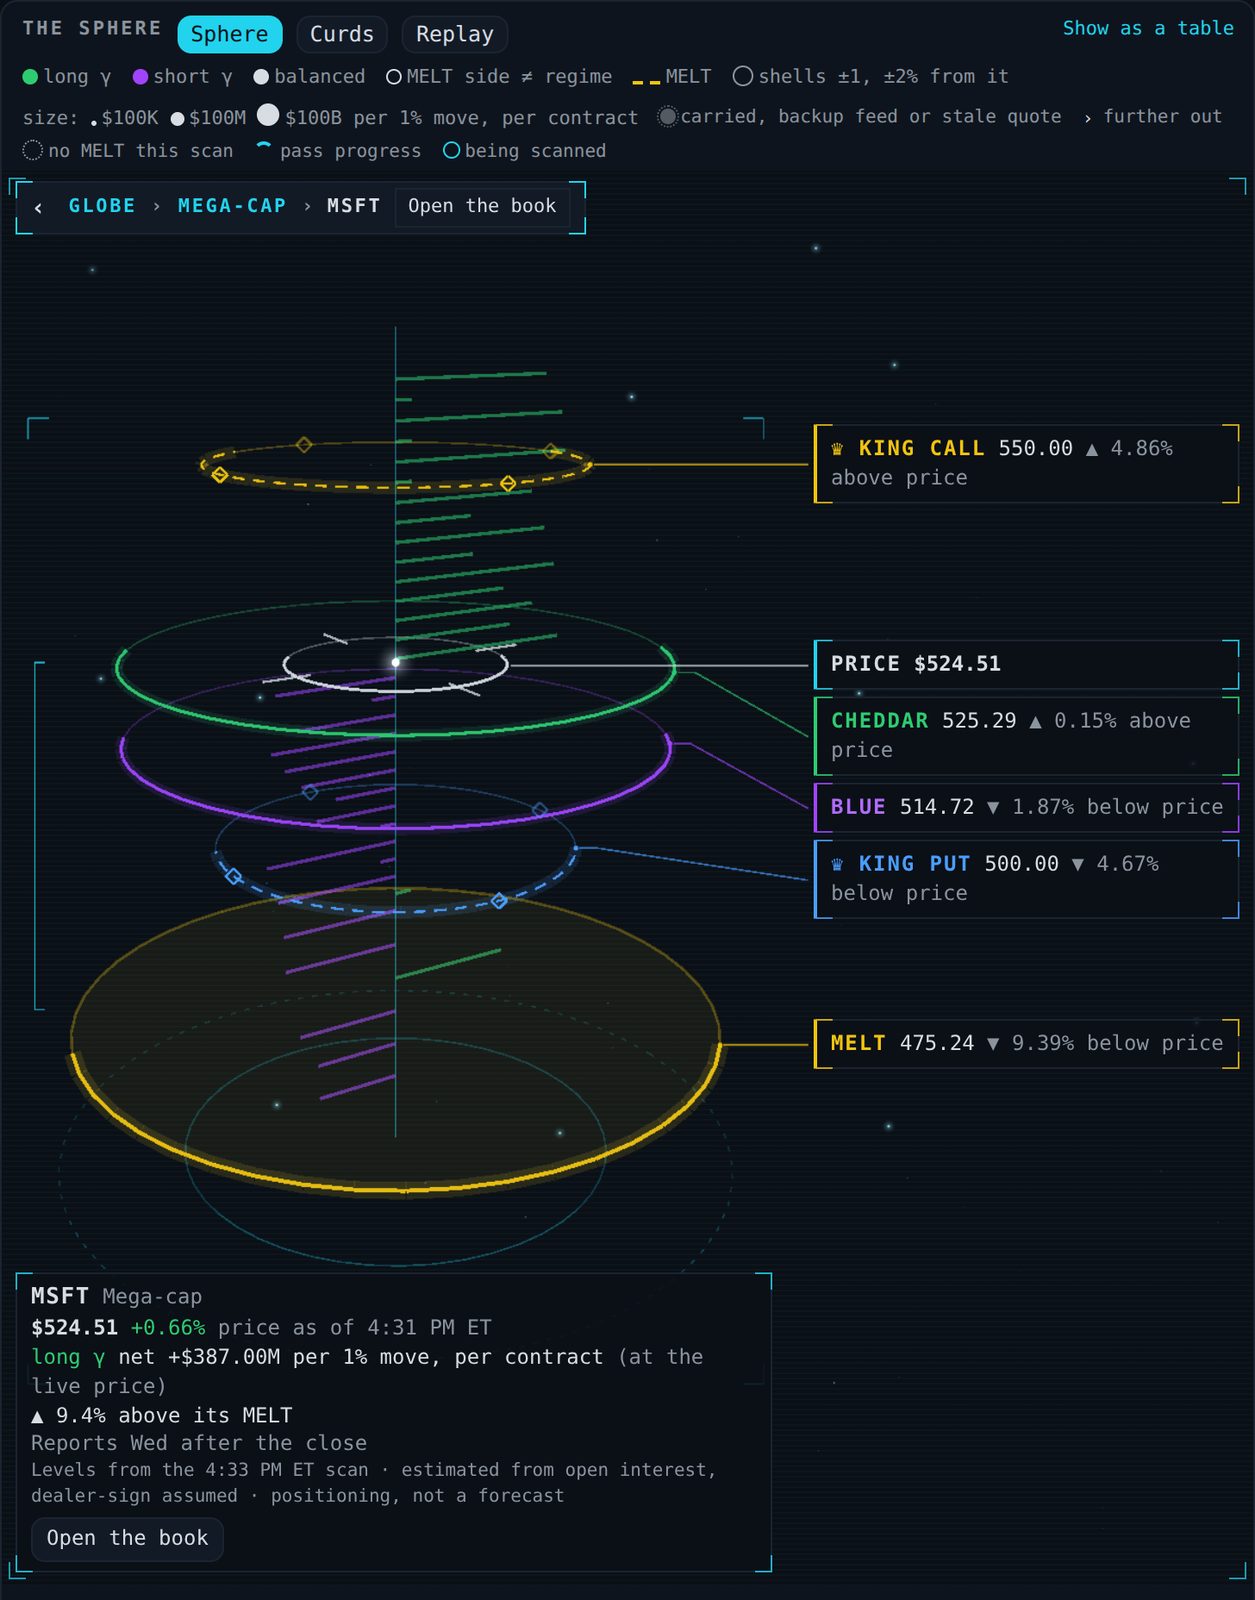
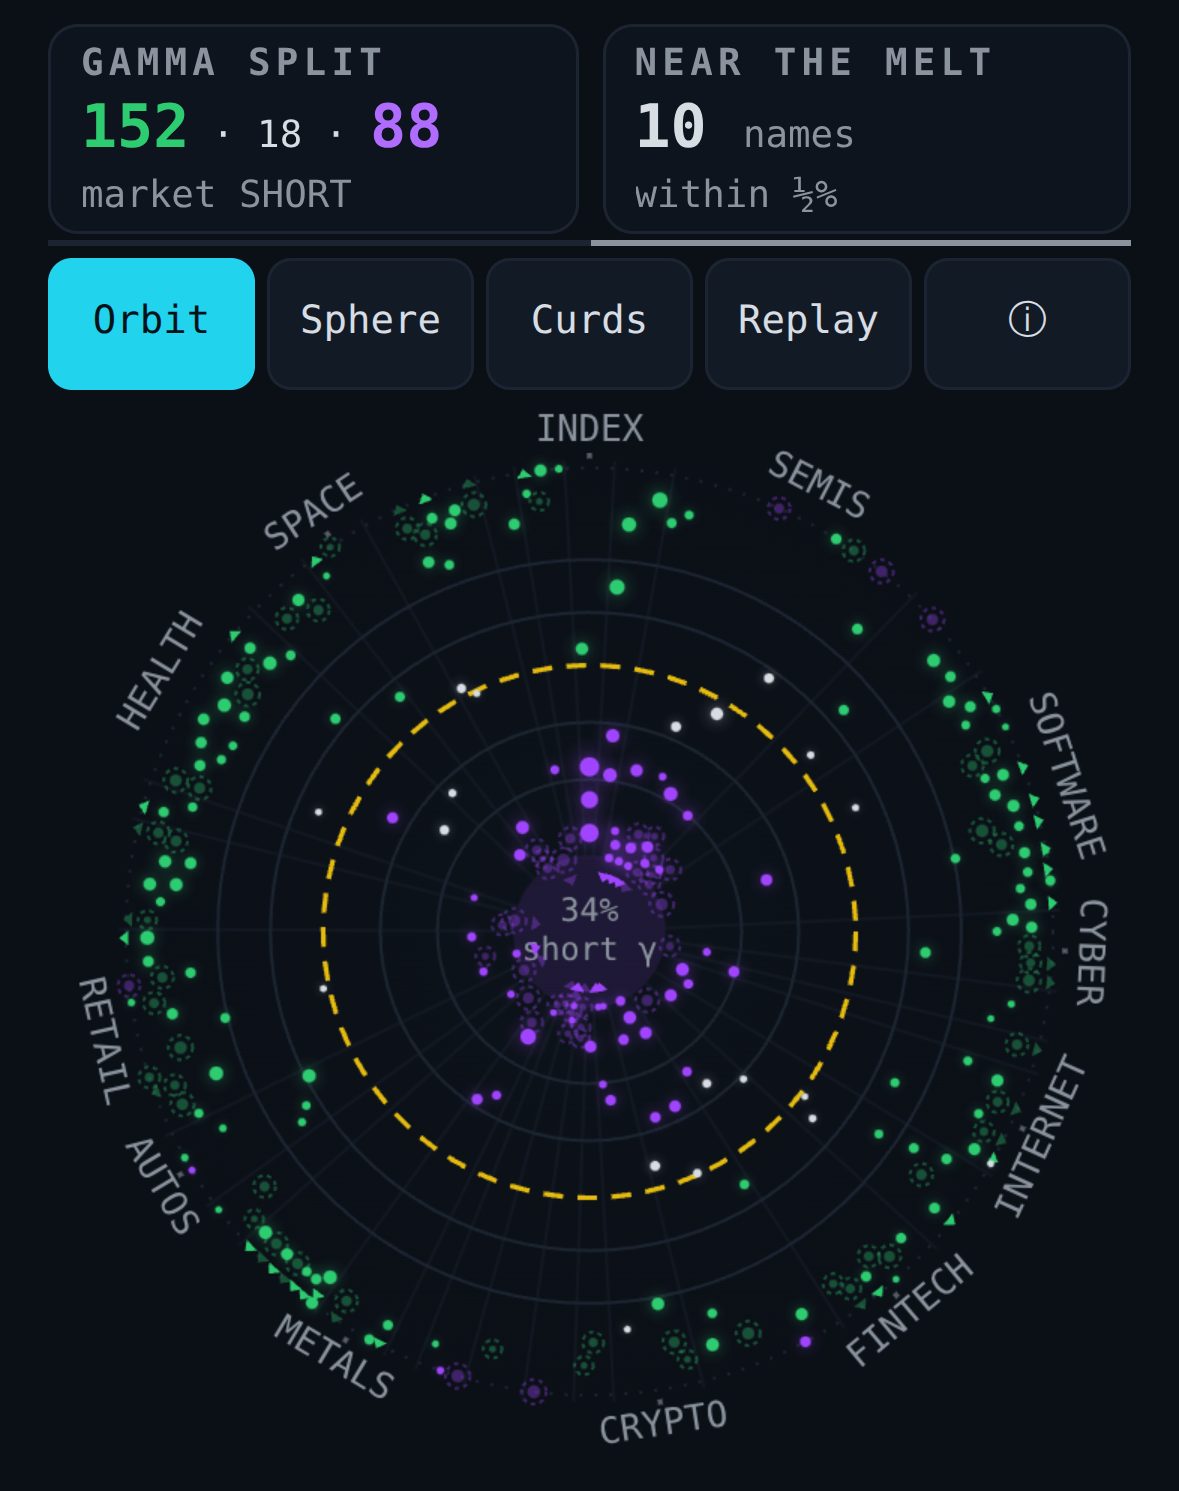
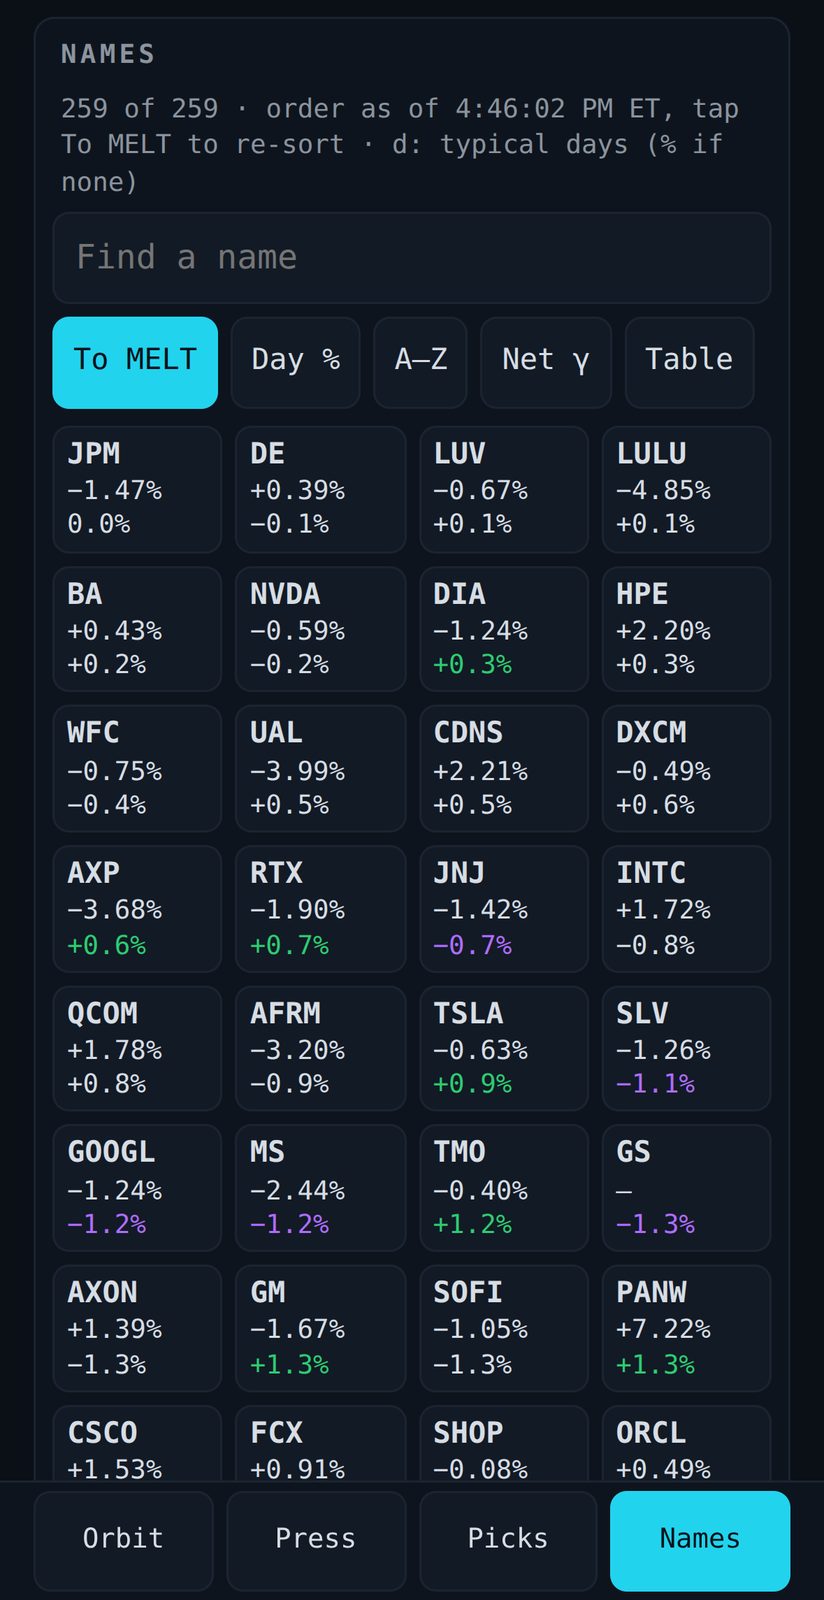
What the tool is telling you — and how to read every board.
CheeseAI & CheeseAI+ · Education and analytics only — not financial advice.
What this tool shows. Not where a stock is going: an estimate, from
open interest, of where the people who must hedge would buy and sell
as price moves. Positioning is context, not a signal.
Easy mode is one tap away. The switch at the top flips between Easy
and Advanced. Easy
gives you one name's whole read in plain English — a one-word verdict (🟢 PINNED = long
gamma, 🟣 TRENDY = short gamma),
and four plain levels: the Call Wall (CHEDDAR, above price), the Put Wall
(BLUE, below), the Line (where dealer gamma changes sign), and
max pain (where the expiring options pay out least). Advanced is every
board and every number; a new account starts there. On a phone, while Easy is
on, the switch at the top reads Advanced ›; on a computer it is the
Easy | Advanced switch.
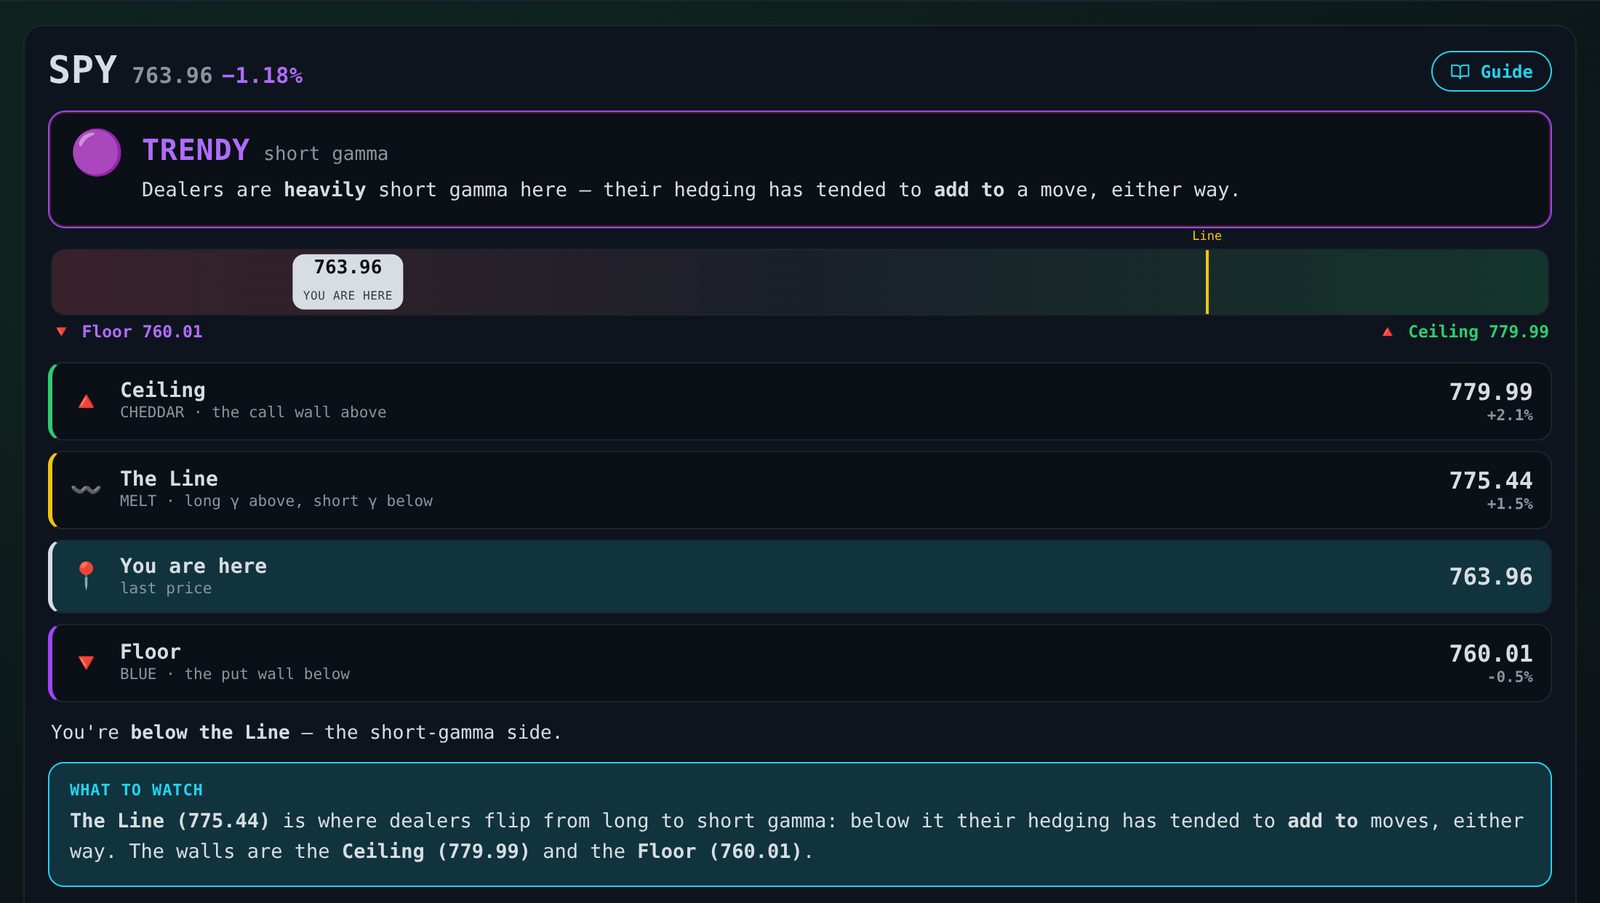
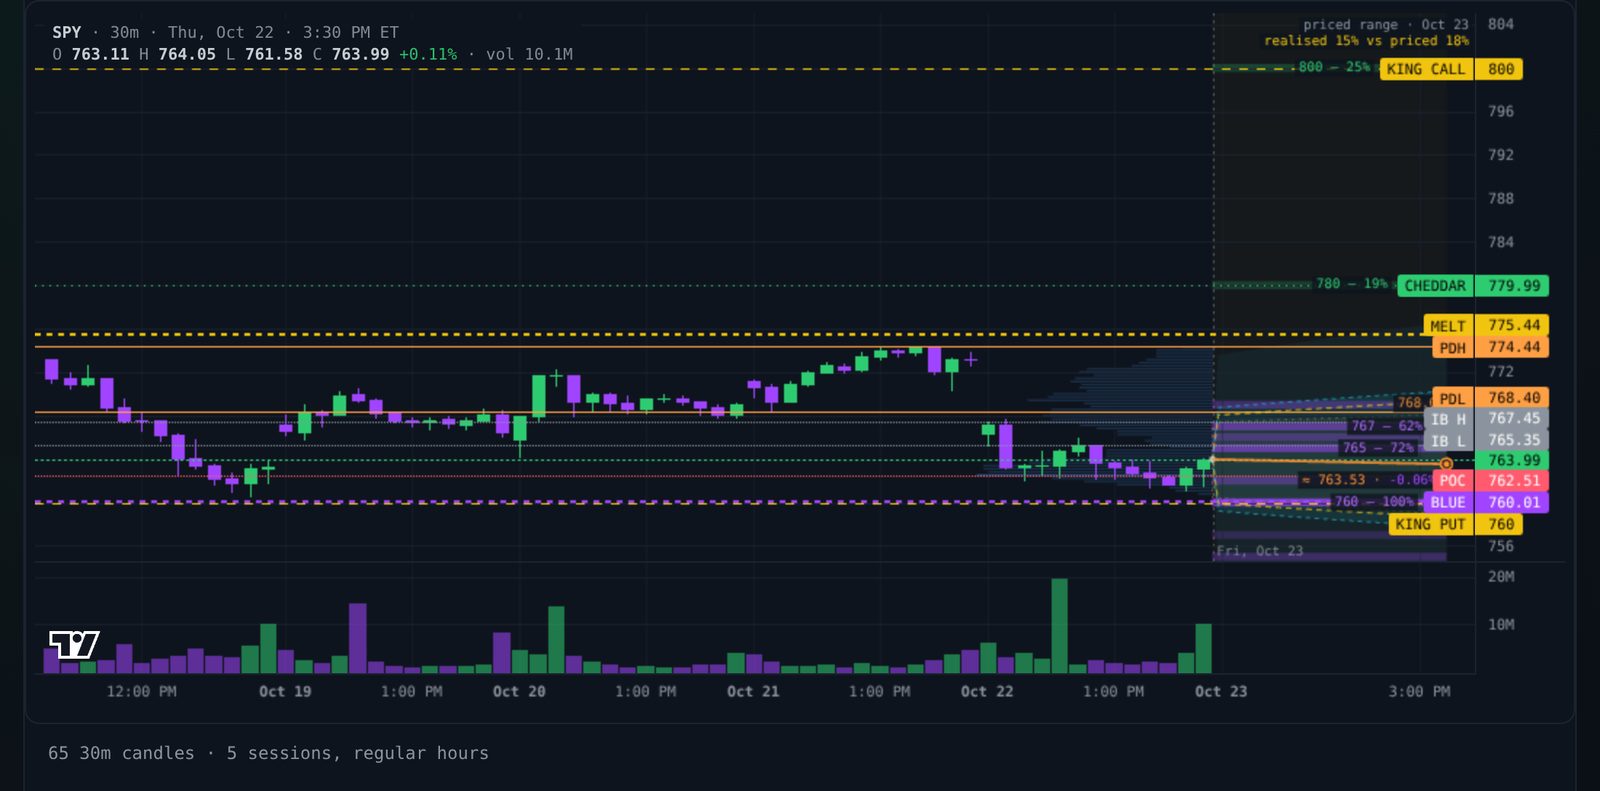
Easy mode on SPY, taken before v1.82, when Easy called the walls the Ceiling and the Floor: TRENDY (short gamma), CHEDDAR 779.99, the Line (MELT 775.44), BLUE 760.01 and where price sat. Max pain wasn't on file that session. CheeseAI · real session, Thu, Oct 22, 2026, after the close.
THE CHEESE BOARD · Handbook
1 · The one idea behind all of it
CheeseAI is your whole trading day in one place, built on where dealers are
positioned. The morning brief, the levels and boards, the alerts on your phone,
earnings, Picks and the evening recap all start from the one idea below.
When you buy an option, somebody sells it to you. That somebody is usually a
market maker (a dealer), and they are not taking a view on the stock —
their job is to provide liquidity. The directional risk they pick up along the
way is a byproduct they immediately want to neutralise, which they do by buying
or selling shares of the underlying.
Gamma measures how fast that hedge has to change as price moves.
Gamma exposure (GEX) puts a dollar figure on it: roughly how much stock
dealers need to trade for a 1% move in the underlying. Every gamma figure, in
the app and in Heat, is quoted per contract (100 shares) unless you flip the one
switch to per share (Settings › Display › More display options › Dollar figures),
and each says which unit it is in. The sign is what
matters:
Dealer position
What they do
Effect on the tape
LONG GAMMA positive GEX
Sell into strength, buy into weakness
Dampens moves: their hedging leans against the move, so ranges have tended to hold. Pinning.
SHORT GAMMA negative GEX
Buy into strength, sell into weakness
Amplifies moves: their hedging leans with the move, so trends have tended to extend, either way.
That single flip — dealers hedging with the move instead of against it
— explains most of what this tool shows you. A quiet, mean-reverting session and
a day that won't stop going are often the same market in two different gamma
regimes. When the two nearly cancel — net gamma close to zero — the board reads
BALANCED rather than force a long-or-short call the book doesn't support.
The other greeks we track
VEX (vanna) — how the hedge changes when volatility moves
rather than price. This is why a VIX crush can lift a market with no other
reason to rally: falling vol mechanically forces dealers to buy.
Charm — how the hedge changes as time passes. The quiet
drift into an expiry, strongest Thursday and Friday of an opex week.
DEX (delta) — the net delta of the open options, calls positive and
puts negative: which way the book leans, not how dealers will hedge it.
THE CHEESE BOARD · Handbook
2 · The vocabulary on the boards
Term
What it is
How to use it
CHEDDAR WALL
The strongest positive (call) gamma strike at or above spot — the call wall.
If no strike up there is positive, the biggest gamma node stands in.
Placed between the listed strikes where that gamma peaks, so it can read 760.01 rather than 760.
The Legend pairs it with its plain name, CHEDDAR · the Call Wall, as Easy mode calls it.
The most call hedging sits there, and it is long gamma
(green): around it, hedging has tended to damp moves rather than add to them.
BLUE WALL
The strongest negative (put) gamma strike at or below spot.
If no strike down there is negative, the biggest gamma node stands in.
Placed between the listed strikes where that gamma peaks, so it can read 760.01 rather than 760.
The Legend pairs it with its plain name, BLUE · the Put Wall, as Easy mode calls it.
The most put hedging sits there, and it is short gamma
(violet): around it, hedging has tended to add to a move rather than hold price.
Named for the cheese.
SHARPNESS (sharp / firm / soft · 0–100)
Under each wall: how concentrated the gamma is at that one strike — how much
more tightly it gathers there than the options listed around it would put it by
themselves, counting only that wall's side of price. A quiet, evenly spread book
reads soft however calm the tape.
Sharp is a hard, narrow pin worth trusting; soft is spread across
neighbours and gives way more easily.
♛ KING GAMMA
The single biggest call-gamma and put-gamma strike with every expiry added up, on either side of spot — the same strike on every board, alert and post. A view's own biggest cell, when it sits elsewhere, is marked ✦ instead.
The level with the most hedging pressure attached — the one to watch. When an outsized node sits on the far side of price from its wall, this is where it shows.
THE CHEESE BOARD · Handbook
2 · The vocabulary on the boards (continued)
Term
What it is
How to use it
MELT (gamma flip)
The price where the whole book's dealer gamma, re-priced at that price,
crosses zero. The Legend pairs it with its plain name, MELT · the Line,
as Easy mode calls it.
The regime line. Above it dampening, below it amplifying. Crossing it
changes the character of the day. The regime is what the standing
option book implies — so when the day's move contradicts it (a
"pinning" name already running hard, or an "amplifying" one dead flat),
the read says so rather than insisting. Positioning is context, not a
forecast, and news outruns it.
◇ BALANCED (MIXED in Easy mode)
A book whose positive and negative strikes nearly cancel: net dealer
gamma is a small slice of the gross — every strike's own net gamma
added up with its sign set aside.
Neither pinned nor trending. A long-or-short label here would be a coin
flip, so the board does not make one; read it as an ordinary chart
until one side takes over.
PULSE (0–100)
One number for which way the option book is leaning on this name, built
only from levels already on the board: where spot sits against the MELT
(weighted heaviest), how much room is left between the two walls, the
day's drift, and whether the walls have moved since the open. Distance
from the MELT and the day's move are measured in this name's own
typical daily move, so a 2% day counts for less on a fast name than on
an index.
It is not a probability. It is how hard, and how consistently,
those four point the same way — so it rises both when the lean is
strong and when the inputs agree with each other, and it is scaled by
the regime, because long-gamma hedging has tended to damp moves and
short-gamma hedging to add to them, and scaled down when a name has no MELT or wall range
to read, so one input alone never reads as full conviction. Under 35
the app refuses to name a direction and says No lean. Read the number as conviction, never as odds.
A low score means one of two opposite things, so the card
distinguishes them: plain No lean is a quiet tape, while
No lean · conflicted means the inputs are individually strong and
pulling against each other — the pressure is there with no agreed
direction. Tap the gauge to see every input and what it contributed.
Market › Pulse ranks every name by this same number.
THE CHEESE BOARD · Handbook
2 · The vocabulary on the boards (continued)
Term
What it is
How to use it
WALL HOLD RATE
Of the tests on record (price reached the wall), the share where the
session closed back on its side.
A test is recorded only when price
actually reached the level — walls nowhere near price are not being
tested — and it is graded on the close: a call wall held if the session
closed back below it, a put wall if it closed back above, or within half a
strike of it — the next strike over is the next level. How often price pushed through intraday first is shown beside
it. Graded against the walls as they stood at the open, so a wall that
broke counts against the rate exactly as loudly as one that held. It is
past behaviour, not a promise: use it to size confidence, not to skip a
stop.
TOUCHED · BROKE · HELD (under each level)
What today has done to CHEDDAR, BLUE and the MELT: touched 2× (price
reached it twice — counted from each minute's high and low, within the
distance the alerts use — and left; at it now, in bold, while it is
there), broke above or below (a minute closed through it; the
MELT says crossed), held since (reached from one side and not
closed through since) and standing 4 sessions (a wall on the same
strike that many sessions running). The Lab's Levels today adds
first reached 9:52 AM ET: when price first reached the level that
session.
A record of where price has been today, not a forecast: held means
not closed through so far. The state belongs to the strike, so when a wall
moves the line says where it was and where it went. A level price has not
reached says nothing — there is no "untested" to read into.
THE CHEESE BOARD · Handbook
2 · The vocabulary on the boards (continued)
Term
What it is
How to use it
BUILT TODAY (the corner dot)
Today's traded volume at that strike and expiry has reached half its
open interest or more.
Separates a live position from an old one. Two cells can carry the same
gamma and mean opposite things: a marked one is being built or unwound
now, so dealers are hedging it today; an unmarked one is interest that
has sat there untouched and is less likely to be defended. Tap a cell
for the exact share. The Heatmap's Change › Built today view is the
same idea in gamma: what today's trades are estimated to have added.
MAX PAIN
The strike where the expiring options would pay out the least.
A reference strike for that one expiry, read from open interest — a level, not a target.
PIN BAND
The gap between the two walls, and where price is sitting inside it.
A sanity check on size. It is the distance between CHEDDAR and BLUE — not
an implied-vol forecast — so a target outside it needs a wall to break,
which is a different bet from an unusually big day.
PIN RISK
How strongly price is being held near a large strike into today's close.
It only scores on the day the max-pain expiry settles; any other day it reads LOW
and names the day max pain belongs to.
High pin risk describes hedging that holds price near the strike: a move
away from it has more of that hedging to get through.
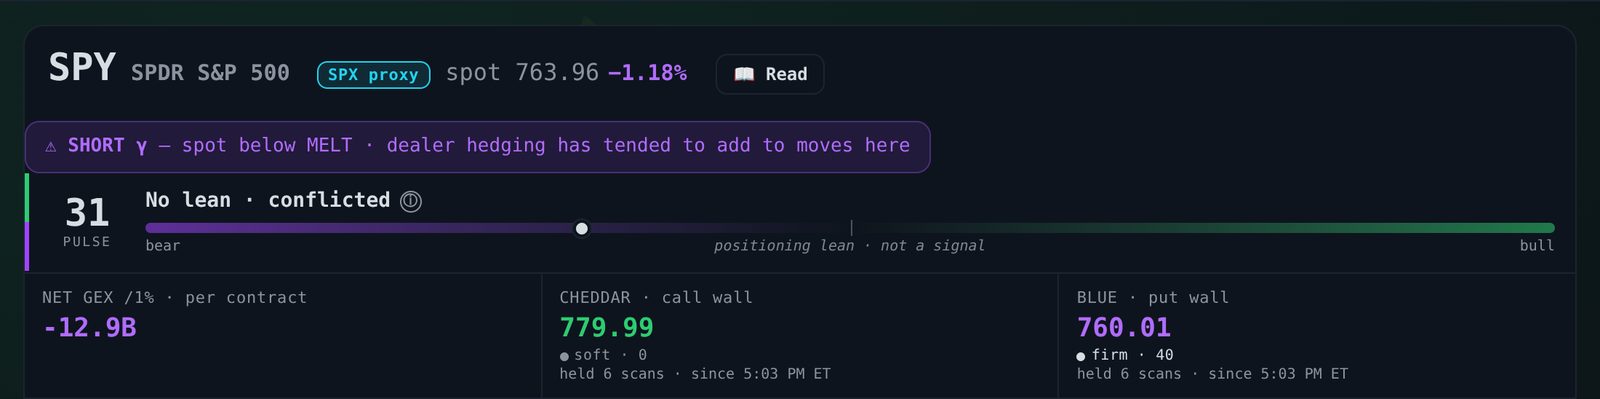
The words above, on SPY's board. The regime line, PULSE at 31 reading No lean · conflicted, net GEX per 1% move per contract, and the two walls with their sharpness: CHEDDAR 779.99 soft, BLUE 760.01 firm. CheeseAI · real session, Thu, Oct 22, 2026, after the close.
THE CHEESE BOARD · Handbook
2 · The vocabulary on the boards (continued)
There is more than one way to define a gamma flip. Ours asks at what
price the whole book would net to zero dealer gamma if it were re-priced
there. Another, common elsewhere, adds net gamma up the strike ladder and takes
the strike where that sum changes sign. Those are different quantities, and on
a real book they are not close — so a flip from another tool can sit some way
off ours without either being wrong. Worth knowing before you put two screens
side by side.
Near-dated expiries count most. Every level adds up every expiry the scan
carries, but they do not weigh the same. An option's gamma near the money grows
sharply as its expiry approaches, so this week's contracts usually outweigh
next month's at the same strike, and a level can move when a big expiry
settles and its gamma leaves the book. When a wall jumps strikes after a
Friday close, that is often why. The Level Clock shows, for each name, which of today's levels sit on contracts that expire soon, and where the levels would sit after those expiries if price stood still (§3).
Why the names are cheese. Cheddar for the call wall, Blue for the put
wall, MELT for the flip. It's a running joke, but it does make the levels
unambiguous — nobody confuses "the Cheddar" with a line somebody drew with a
trendline.
Each word has a page of its own. CHEDDAR, BLUE, MELT, the kings, max pain
and PIN RISK each have a free public page with one dated example from a finished
session, and one more explains why the levels change once a day. Worth sending to
someone new to the boards:
cheeseai.app/learn. They read in
order too: Start here on the words page leads through each word, one step
after another, with the step before and the next on every page. In the app, a
tap on the CHEDDAR, BLUE, MELT or MAX PAIN tile under a name opens the word in
one line, with its page and the other words a tap away (max pain's with the
0DTE board too). They are definitions, not a
course.
THE CHEESE BOARD · Handbook
3 · The boards, one by one
Finding your way
Every tool has one home you can guess, and each screen stays quiet until you
ask for more. On a computer the top bar is one row: the brand's app menu,
CheeseAI+ ▾ (CheeseAI ▾ on CheeseAI), the status pill, Settings,
More and the version number; on CheeseAI an Upgrade pill sits beside
Settings. Under it, the next scheduled print, VIX and the ticker tape; then
Start here and the morning brief as one line each; then Easy | Advanced,
the name box and Search; then the nine boards as tabs.
The status pill says in a word where the market is — Open, Pre-market,
After hours, Overnight or Closed — and when the data was last updated, in ET. Its
dot is green while the market is open and prices are live, grey outside the
session, amber when something runs behind (it says which in words: Delayed 15 min,
Backup feed or Prices 2 min behind) and red when the data is stale or the page is
offline. Tap it for Data: the time to the close or the open, when the next
update is due, the names on the backup feed, Refresh now (R on a computer),
the status page, and how often this page checks for new data, which Settings ›
Display › More display options › Auto-refresh changes.
The ticker tape starts with the twelve big names CheeseAI scans (the index
funds and the largest companies) and, on CheeseAI+, your watchlist, unless you
pick your own in Settings › Boards › Ticker tape. It moves only while the market is
open, and on a phone it is off unless you turn on Show the tape on phones
there.
On a phone the top bar reads the brand's ▾ (its mark alone where room is
short), the status pill with the time, the next print's chip on a print day,
Easy and the version. The bar at the bottom is the same on every screen:
Home, the boards and apps you pin, and More at its end. Until you pin
your own it holds, on CheeseAI+, your first two boards, 🔥 Heat and 🧪 The Lab; on
CheeseAI, your first three boards and The Lab with a 🔒. A name too long for its
slot shortens, so Charcuterie reads Charc. On a name's board ‹ Back names the board
it goes back to.
THE CHEESE BOARD · Handbook
3 · The boards, one by one (continued)
Finding your way · the app menu, More and Settings
The app menu. The brand at the top, CheeseAI+ ▾, lists the other apps
with a line on what each is: 🔥 Heat, 🧪 The Lab, 💧 Flow, 🖨️ Print Shop, 💼 the
Portfolio Manager and 🧭 Compass. Each of them, and the Picture Book, opens the same menu from its
own name at the top, with CheeseAI+ first, the way back to the board you came from.
On CheeseAI the menu reads CheeseAI ▾ and lists, under With CheeseAI+,
those apps and what CheeseAI+ adds to the boards (Ask Jack, your watchlist, notes
on each name and your levels), each opening the Upgrade sheet with its own row
first.
More is in the same order on a phone and a computer. Go to, on a
phone, lists the boards that are not on the bar. This screen has Ask Jack
whenever its button beside the name is off the screen, Share, and on a name's
board one fold, Tools for this name, with the tools for the name on screen,
the Cheese Wheel, If price were at… and Copy this name's levels among them; on a
phone it leads with Read, the board's read and The full read in one sheet (a
computer has Read in the board's header). Your
day has the morning brief, the evening recap, the market calendar, Alerts
(always listed: on a day nothing has fired yet it says so), the Picture Book and,
when one is scheduled, the Cheese Stage. You has your watchlist
(CheeseAI+), Settings on a phone, and Help. The Tools fold stays open or shut as
you leave it, and Everything open opens it with every other panel.
Settings opens on Alerts and has four short panes. Alerts: alerts on
this phone or computer, Send a test, your devices and quiet hours; Also send
me, the morning brief at 9:00 AM ET and, on CheeseAI+, your watchlist radar and
flow push; and on CheeseAI+ What buzzes you, four groups (Levels, Setups and
Picks, Calendar and filings, Your levels) with Pick each kind for the eleven
kinds, your watchlist alone and muted names. Display: theme, density, time
zone, layout, side boxes, page size and full screen, and More display options
for the market clock's themes, the Heatmap colours, Dollar figures, Auto-refresh,
the background mark, vibrate on taps and Everything open. Boards: your
boards in order (drag them, or ↑ ↓; on CheeseAI+ a tap shows or hides one), On the
phone's bar for The Lab and Flow, and the Ticker tape. Account: your plan,
Manage on Whop (on CheeseAI, Upgrade to CheeseAI+), Check my access, the Store,
About & legal, Reset to defaults and Log out.
THE CHEESE BOARD · Handbook
3 · The boards, one by one (continued)
Finding your way · Help, the tour and Easy
Help is the one home for what teaches: More › Help and, on a computer, each
board's ⓘ About this board and ?. In order: Start here, Guide to this board
(with Everything on this board, a note on every part of it), the Legend, Words (the
public word pages), the Handbook, What's new, Is the data fresh? (the status page),
Send feedback and, on a computer, the keyboard keys. Each app's own guide is called
How to read. What's new opens on everything you haven't read, at least the
newest three, with Earlier updates under them; a gold dot on the version number,
and on Help's What's new row, means something shipped since you last looked (where
the number has given way, the dot sits on More).
A new account starts with a three-step tour on the name it arrived on (SPY
if none): the three prices that matter, CHEDDAR (the Call Wall), the MELT (the
Line) and BLUE (the Put Wall); what the regime means today, read from open interest
with the usual dealer-sign convention, context and not a signal; and where things
live. It ends on Open SPY's levels →, with Start in Easy mode instead
under it, and finishing it is saved to your account, so a second device never
repeats it. Then Start here · 1 of 5 sits at the top for the account's first
two weeks: the tour, your names (up to three, which can set up the tape, the name
on screen and, on CheeseAI+, your watchlist, in one confirm), alerts on this device
(the Add to Home Screen steps first where a phone needs them), five two-minute
lessons, and Easy or everything. ✕ puts it away; Help › Start here keeps it.
Easy shows one name in plain English. On a phone its switch sits at the
top and, while Easy is on, reads Advanced ›, the way to every board; on a
computer it is the Easy | Advanced switch beside the name box. Opening a
board from Easy leaves it and says how to come back. On a phone Easy's bar is Easy, 🔥 Heat, 🧪 The
Lab, 💧 Flow and More on CheeseAI+, and Easy and More on CheeseAI. On a computer
Easy also hides the tape.
THE CHEESE BOARD · Handbook
3 · The boards, one by one (continued)
Finding your way · quiet by default
The panels you don't need every minute start folded, and each stays open or shut
as you leave it: a name board's line of key numbers, Replay, Market backdrop on
Market, How the projection has done on 0DTE, the price chart under a phone's
Heatmap, the morning brief and the evening recap (one line each until Show all) and
More's Tools fold. Side boxes on a wide screen start Compact. Settings › Display
› More display options › Everything open opens every panel again, on every
device you sign in on; a one-time line on your first board after the change says
so.
A name's board leads with one line of key numbers: PULSE, the regime, NET
GEX, CHEDDAR, MELT and BLUE, then ▾, which opens the regime chip, PULSE, the
nine tiles, the why lines, the freshness row and PIN BAND in place, and that board
remembers it. Tap CHEDDAR, MELT or BLUE on the line for the word; a level price is
at right now says at it now, in bold, and one that moved today carries a
dot. The board's header has Read (the board's read and The full read, one
sheet) and ⓘ About this board. GEX | VEX is on each board's own bar, and the
Heatmap's and 0DTE's other choices are View options on a computer and
Filters on a phone.
THE CHEESE BOARD · Handbook
3 · The boards, one by one (continued)
🏠 Home (on a phone)
On a phone, and in the app installed on one, the app opens on Home: every
board, app and everyday tool as a tile, the way your phone lays out its apps. At the
top, Find a name opens the name search, and a pick opens that name on your last
name board. Under it the majors line reads SPY, QQQ and IWM: the price and the
day's move on the same live prices as every board, and with Show whether
dealers are long or short gamma there. It describes positioning, not which way price
goes next.
Then the tiles, in sections: Boards, every board you show in your order;
Apps, ringed, the CheeseAI+ apps and the Picture Book; Your day,
Alerts, the market calendar and, on CheeseAI+, your watchlist; and You,
Settings, Help and What's new. A count on Alerts is how many alerts came in since you
last opened Alerts on that phone; a dot on What's new is an update you haven't read.
Tap a tile to open it; Back brings you to Home, and the next Back leaves the app.
Hold a tile for its card: what it is, Add to bar or Remove from
bar, on CheeseAI+ Hide for a board, and Edit Home. Edit Home (also
the Edit button by Boards) moves a board with ‹ › or a drag and pins boards and
apps to the bar with On the bar, four at most; the board order is the one your
computer's tabs use. On CheeseAI+ − hides a board from Home, the bar, Go to and
your computer's tabs, and Settings › Boards brings it back.
Coming back: open the app again within half an hour, in the same session,
and you land where you were. Settings › Display › Open the app on picks Home
after a break, always Home, or your last board; a tablet starts on your last board. A
link to a board, an alert on your phone or a shared link always opens that board
directly. Computers keep the tab row and open on your last board.
THE CHEESE BOARD · Handbook
3 · The boards, one by one (continued)
🗺️ Market
The whole market on one tab, seven ways (toggle at the top), and on
CheeseAI+ an eighth, 📡 Radar, your own watchlist, with its card below.
Grid shows
every tracked name's regime — green tiles pinned (long gamma), violet trending
(short gamma) — with Market Gamma aggregating the universe into one number and
counting the names long γ, short γ and balanced, broken out by sector, plus a
ranked sector gamma bias. Tap a sector for
its own sheet: its names nearest their MELT first, how many are long or short
gamma, who reports by the week's last close and its biggest ♛ king; on CheeseAI+
one tap sets its four biggest books side by side on Charcuterie.
Ranked sorts the same names
by how actionable the tape is, with earnings badges — your morning shortlist.
💓 Pulse ranks every name by its PULSE, the lean on its Profile, with bulls
and bears in separate lists, strongest first. Each row shows how many places the
name has climbed or slipped since the open and a small line of its PULSE every 15
minutes through the session, and a name that turned to its lean since the open
is marked NEW with the time. Names under 35 are folded away as No lean.
Before the open the lines are the last session's, and nothing counts as moved
until 9:30 AM ET. Between updates Ranked, Knife and Pulse
re-sort on the live price about every ten seconds, never while your pointer or
keyboard is on a row; the other lists keep the update's order.
🩸 Dips reads a bounce on every name down hard today, with per-depth
(−5/−10/−15%) track records. 🔪 Knife lists names sitting right on their
MELT, where a small move would flip the name long↔short. 💥 Unusual
ranks the day's biggest option trades where volume ran well above open interest
— mostly opening new positions — with the aggression and any sweep; contracts
expiring today or tomorrow are left out, because their volume is same-day
churn rather than new positioning. Positioning context, never a signal: a big opening trade is as often a hedge as a bet.
The same list is one key away from any board on a computer: U opens
Market › Unusual, and ‹ Back returns to where you were. On a wide screen it is
also a box in the right-hand side lane. Tap a row to open that contract on
Options.
THE CHEESE BOARD · Handbook
3 · The boards, one by one (continued)
🗺️ Market · 🌡️ Vol
🌡️ Vol is what options are charging. The top card is the VIX index
curve: Cboe's spot indices from one day out to a year (1D, 9D, VIX, 3M, 6M, 1Y)
on a log scale of days, today against the session before. They are spot
indices, not VIX futures. A grid reads the level (under 15 calm, 15–20 normal,
20–30 nervous, 30+ fear) against the curve's shape (VIX/VIX3M under 0.90
contango, the ordinary state; 0.90–1.00 flat; over 1.00 inverted, protection
bid now), with where VIX sits against the last year and the last five, and
VVIX and SKEW beside it as Cboe's own levels. Under those, SPY's
put/call volume sits beside its own record (see Options). Below it, Options vs
movement sets each name's 30-day implied vol (IV30) against what its
typical day over the last few weeks works out to on the same scale, the
realised figure on its Price chart. Above 1.1 is priced above its movement,
below 0.9 priced below, in between in line; options usually price a little
above recent movement, so a ratio a bit over 1 is ordinary, and neither band
is a signal. A name that reports before its 30-day options expire is kept out
of the ranking, because the print is in the price; it sits in its own group
with an estimated ratio after the earnings premium is taken out. There is no
IV rank yet: that needs a year of stored daily readings, which are still being
collected.
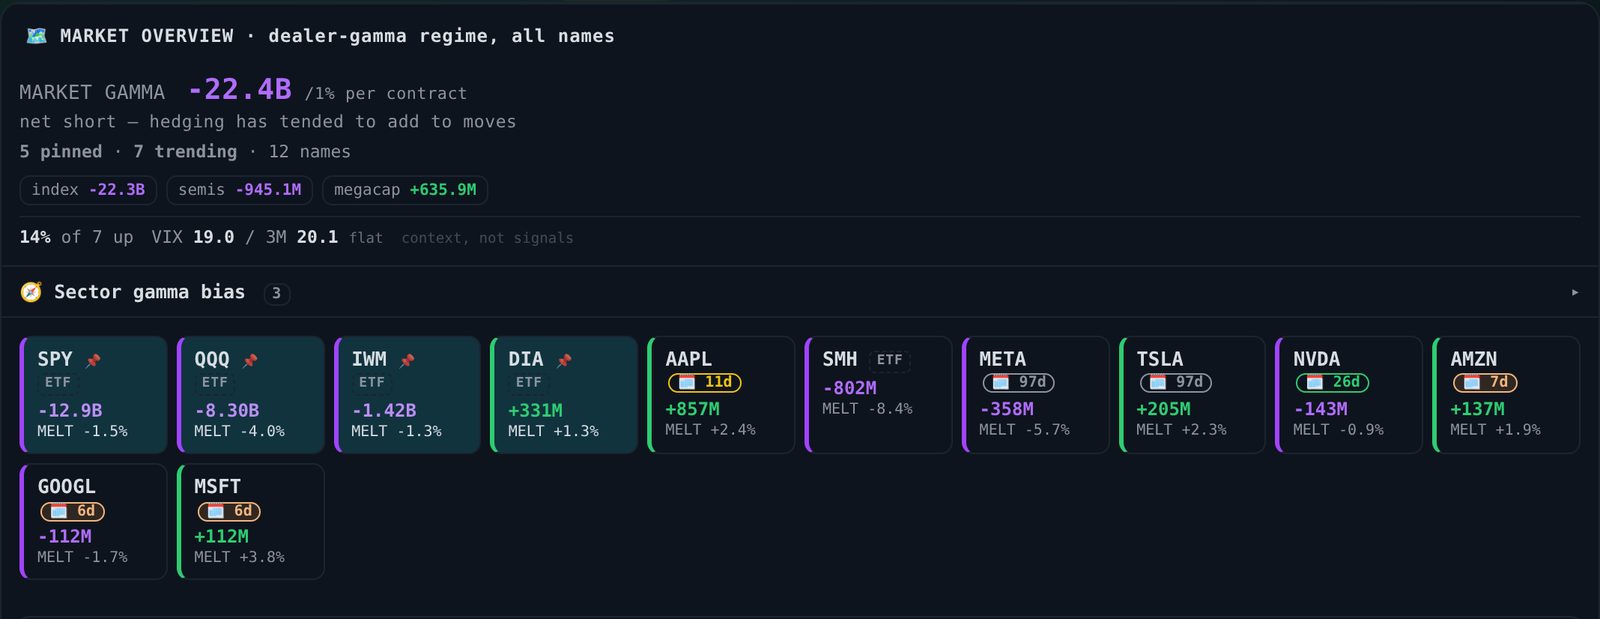
Market › Grid. Market gamma per 1% move, per contract, across the twelve names, its split by group, and each name's tile: green edge long gamma, violet short, with its net GEX and how far price sits from its MELT. CheeseAI · real session, Thu, Oct 22, 2026, after the close.
THE CHEESE BOARD · Handbook
3 · The boards, one by one (continued)
📡 Market › Radar (CheeseAI+)
Your watchlist, nearest a level first: each name ordered by how close price
sits to its MELT, CHEDDAR or BLUE (or the MELT alone, or the walls alone),
measured as (price − level) ÷ price, with a line that places price among the
three. The order follows the live price, re-sorting every few seconds but never
while you are touching the list. Its radar alerts push when a name comes
within your distance of a level — 0.25%, 0.5%, 1% or 2% — once per crossing: a
name already inside does not buzz, and it re-arms once price is 1.5× your
distance away. Your watchlist, under More › You, opens it. On a wide screen its
five nearest also sit in a 📡 Radar side box, in the same order. How far price
sits from a level, never what it does there.
💥 Unusual › Flow push (CheeseAI+)
One rule, set on the card at the top of 💥 Unusual: when a scan puts a new
row there for a name on your watchlist, paying at least the time value you
picked — $250K, $500K, $1M, $2.5M or $5M — your phone hears about it, with
the contract and what made it stand out. Once per contract a session, up to
10 a day, biggest first, regular hours only; quiet hours and muted names
hold, and the Alerts list says why one was held. Switching it on, starring a
name or lowering the size does not push rows already listed. It is checked
as each scan lands, not trade by trade, and Unusual is built from what each
scan reads of the day's option trades, so it can miss some: a heads-up, not
every print. A big opening trade is as often a hedge as a bet.
THE CHEESE BOARD · Handbook
3 · The boards, one by one (continued)
💥 Reading an Unusual row
Each row on 💥 Unusual says three more things than its size.
Opening is the floor the numbers prove: a close needs a position to
close, so at least (volume − open interest) ÷ 2 contracts opened, and the
tooltip gives the count. The lean is which way the read trades went:
bought calls and sold puts lean bullish, bought puts and sold calls bearish,
a two-sided contract leans nowhere. A ▣ block is one print of at least
250 contracts that is also at least 40% of what was read. A name with two or
more rows gets one line on top: its read premium, which way it leaned, whether
it was mostly opening and its nearest expiry. A lean is
not a position: a sold put can be a hedge as easily as a view.
Did it stick?, folded under the list, sets the last session's top
prints beside the next morning's open interest: the session's volume, the open
interest each contract started with, the morning's, and the change. Open
interest is counted once a day, overnight, so the morning's figure is the
first that can include those trades. The change is the contract's whole day,
every trade on it and not only the print, so it cannot say whose position
stayed open; read it as numbers, not a verdict. Only contracts inside the
range the boards cover can be read; the rest show a dash.
Back again, folded beside it, looks back five sessions before the
board's. A row whose contract made the list on one of them says when, and so
does one whose strike did on another expiry. The fold lists each contract on
the list more than once, with its volume in each session and the open interest
it started each with, then each strike that came back on another expiry. A
contract back on the list can be one position built up, another opened against
it or a hedge rolled: numbers, not a verdict.
THE CHEESE BOARD · Handbook
3 · The boards, one by one (continued)
🗺️ Market · the calendar and the tape
Two market-wide facts sit on this board because they belong to the market
rather than to any one name. The 📅 macro calendar lists the scheduled
prints that move the whole tape — CPI, jobs, PPI, PCE, GDP, retail sales, JOLTS
and the four central bank decisions (Fed, BOJ, ECB, BOE), plus US election
days — with the day's own
print lit and counting down, and the official number on the row once it is out.
Under Market Gamma, Market backdrop folds the tape to one line, VIX and
its mood and the share of names up; ▸ opens it, and it stays open once you do:
breadth, the board's own put/call, VIX against VIX3M and the curve, credit and
claims backdrop, and the current Fed target range and ECB deposit rate —
context, not a signal. The
🧱 wall track record
scores how often a wall has actually held, across every tracked name.
The 📅 chip at the top opens the full market calendar — four months
of it — and so does More › Your day › Market calendar. On a print day the chip
carries the print all day; on a phone it shows only then. Alongside the prints it carries the
dates that matter most to what this app measures: monthly OPEX, the third
Friday, and quad witching, the quarterly one in March, June, September and
December. Your levels are built from open interest, and on an expiry whatever
expires stops existing — so the walls you have been reading all month are rebuilt
from what survives. A wall can look like it vanished overnight when nothing
happened except the calendar. The days the market is shut or closes early are
in there too, since no session means no new levels. Under the four months, the
CPI and Fed days already past that the replay still holds each open that
session in Profile › Sessions.
Look for: a market where most names are violet — a day when hedging has
tended to add to moves rather than damp them. Or one violet sector in a green
tape, which is where the book is least settled. The top of Ranked is where the
books sit short gamma, close to their MELT or with one-sided flow.
Common mistake: treating a violet tile as bearish. Short
gamma means moves get amplified, in whichever direction they start.
It's a volatility read, not a direction read.
THE CHEESE BOARD · Handbook
3 · The boards, one by one (continued)
☀️ The morning brief and the evening recap
From 9:00 AM ET on a trading day, a card at the top of the app puts the
morning in one place: SPY, QQQ, IWM and DIA with their BLUE, MELT and CHEDDAR
and the gamma read of each, today's scheduled releases with their times, the
day's notes (an expiry, a half day, quarter end) and the names sitting right at
a wall. It is the premarket brief the Discord gets, from the same scan, and its
prices move with the live price; in the app it also gives VIX and the names
reporting after today's close and before the next open, and what changed
overnight across every name: each one whose CHEDDAR, BLUE, MELT or ♛ king sits
somewhere new since the last close, or whose regime flipped, with the line for
why a wall or king moved (open interest at the old and new strikes, read against
our own snapshot from the session before). On CheeseAI+, Your names picks
out your watchlist names at a wall, in that list and reporting today. It shows levels only from a scan of today:
before the first one lands it says so rather than show yesterday's. It opens
folded to one line; Show all opens it (on a computer it stays open for the
day). The card says whether it is also sent to your phone at 9:00 AM ET, and
the switch is Settings › Alerts › Also send me: one notification a
morning, off until you turn it on, your quiet hours applying. ✕ puts it away
for the day and More › Your day › Morning brief brings it back.
After the close the evening recap takes its place: on how many names
the day's range stayed between the walls as they stood at the open, and for
each name its close, the day's high and low and where they sat against those
walls (inside, above CHEDDAR, below BLUE, or not graded when the morning's walls
or the day's range are missing), with its BLUE, MELT, CHEDDAR, max pain and net
GEX. On CheeseAI+, Your names grades each of your watchlist names the same
way, wherever it ranks. ‹ and › step back through the last five sessions. It stays up
through the evening and the weekend, folded to one line like the brief, and
More › Your day › Evening recap brings it back. Both say where things stood, never what comes next.
On the week's last session (Friday, or Thursday when Friday is a holiday),
once the week's Picture Book is ready, a card of its own, The week, sits
beside the recap with See the week. ✕ puts it away on that device without
touching the recap, and it steps aside with the recap at 9:00 AM ET.
The brief, the recap, the week's card and Start here share one slim row
above the board, side by side, on a phone and a computer, so the board keeps
its room. On a phone Show all opens a card over the board; Less, a tap
outside it or Back puts it down, and ✕ still puts it away. A tap on the week's
card opens the week. In Easy mode the row keeps Start here alone.
THE CHEESE BOARD · Handbook
3 · The boards, one by one (continued)
📖 The Picture Book
At 4:30 PM ET on every trading day (1:30 PM on a half day) the day is put
together as a short book of pictures, from the scan that came after the close. A
cover shows every name the app read and how many ended long gamma, short gamma or
balanced. SPY's, QQQ's and IWM's days are drawn against their walls, the MELT and
max pain, with when price reached them. Then come the names that turned long or
short since the open, the walls reached and broken through, the MELT crossings,
the biggest moves in each name's own typical days, where the most hedging sat at
the close, the names that closed by their max pain and how many kept the day's
range between the walls set at the open. A last page says how to read it, and a
page with nothing to say is left out. On the week's last session the book also
carries the week (below).
Open it from More › Your day › Picture Book, or from the evening recap. Each page is a
1080 × 1350 picture, the shape a feed shows whole. Save keeps one page,
Save all pages keeps the day as one zip, and on a phone Share sends
them straight to another app. The last twenty sessions stay readable. Like the
recap, it says where things stood, never what comes next, and every picture
carries "Education and analytics only, not financial advice." and the site's
address.
THE CHEESE BOARD · Handbook
3 · The boards, one by one (continued)
📖 The Picture Book · the chapters
After the day come the chapters, one for each part of the app, each with its own
chip at the top. The Heatmap draws SPY's, QQQ's and IWM's grids as they stood
at the close: the 17 strikes nearest the close, high first, across the five nearest
expiries still to come, green long gamma and violet short, brighter where more
hedging sits, each cell printed per contract. CHEDDAR and BLUE are named on their
rows, ♛ crowns the kings, the MELT is the dashed gold line and the close the line
in white. Each page names its biggest cell, and the chapter ends with how to read
the grid.
Charcuterie sets its two sets side by side, SPY · QQQ · IWM and
AAPL · NVDA · TSLA: each column is one name's gamma by strike with every expiry added
up, the 15 strikes nearest its close, scaled to its own biggest strike so the shapes
compare and the sizes don't. Each page says whether the set ended on one side or
split, and where each name closed against its walls.
Earnings shows the names that reacted to a report today, each day's move set against that name's own
typical day, and a calendar of who reports next: today after the close and the
sessions after it, each name under its day, before the open or after the close, as
the company has set it. It carries dates and moves only; what the options price
into a report stays on the Earnings board.
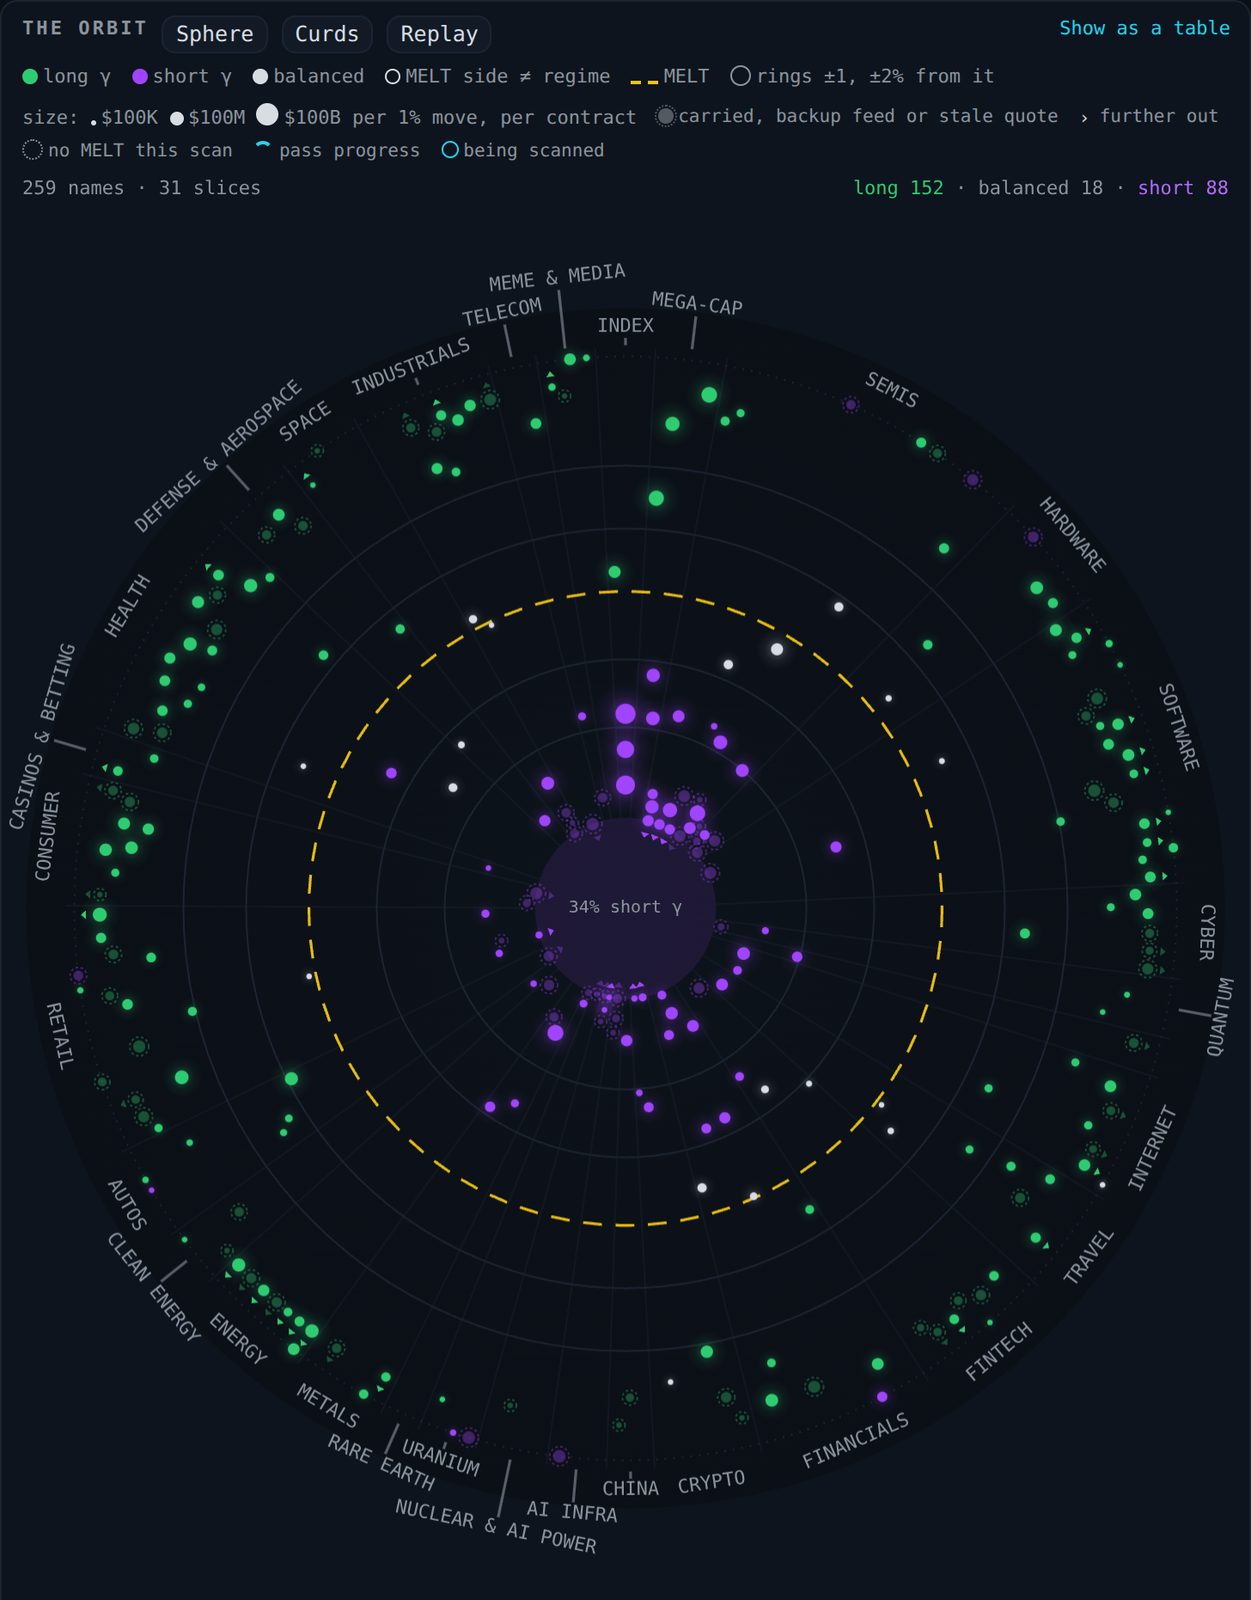
On CheeseAI+, The Orbit draws the Lab's Orbit as it stood at the close: every name a dot in its sector's slice,
outside the gold ring above its MELT and inside below, by its own typical days,
green long gamma, violet short, hollow where the MELT and the regime disagreed,
bigger for more net gamma; then the biggest slices by how many of their names
ended long, short or balanced.
On CheeseAI+, Heat draws Heat's cards as they stood at the close, one page for the themes and one for the biggest
sectors: each card's middle move (half its names did better, half worse), how many
of its names closed up, how many closed below their MELT and its biggest king.
Then Heat's Breadth calendar for the last twenty sessions, a row for each of the
biggest sectors under every sector together, each cell the share of its names
that closed above their MELT, green over half and violet under. Save all
pages saves the chapter you have open.
THE CHEESE BOARD · Handbook
3 · The boards, one by one (continued)
📖 The Picture Book · the Level history and the week
Level history closes every book: SPY's, QQQ's and IWM's last twenty
sessions, one column each, the oldest on the left. CHEDDAR is the green mark,
BLUE the violet one and the MELT the gold dashed one. Each is drawn as the
session opened against it: the board's read at that session's open where one is
on record (for the book's own session, the same walls its other pages call the
walls at the open), else the levels record's final read after the session before
closed. The dot is the close: filled when it closed between the walls, hollow
outside them. Each page counts how many closed between CHEDDAR and BLUE, both
walls together, and says where the levels went over the stretch. A session with
no levels on record is left out, and after a split only the sessions on the new
prices are drawn.
On the week's last session (Friday, or Thursday when Friday is a holiday)
The week comes first after the day, with its own Week of … chip
beside that day. It reads the week's day books together, so it has no walls of
its own: each session is set against the walls set at its own open. A page for
each index major draws its sessions' ranges, those walls, the MELT at each close
and the close. It says how many sessions kept the whole range between the walls,
which walls it reached or broke through, and how it ended each day. Then come the
turns to long or short gamma, the walls reached and broken across every name, how
many name-sessions kept inside the walls (inside counts a session only when its
whole range stayed between both walls; past either one, it left them), and the
week's biggest single-session moves in typical days. A session with no book is
left out, and the first page says so. The week and the Level history are on both
tiers.
THE CHEESE BOARD · Handbook
3 · The boards, one by one (continued)
🟩 Heatmap
Two views, toggled at the top. ▦ Grid — the one the board opens on, on a
computer — shows every strike (rows) across the nearest 7 expiries (columns);
📊 Ladder reads a single expiry top to bottom, strike by strike, and is
where a phone opens until you pick Grid. Green
cells are positive gamma, violet negative, and the brighter the cell the
bigger the number — brightness is scaled across the whole board, so the
expiries actually carrying the gamma stand out. The two crowned ♛ strikes are
the king nodes, the call king (gold) and the put king: the single largest
positive and negative gamma strikes with every expiry added up, crowned on the
strike axis too; a ✦ marks the largest
cell in the view you have open when that is a different strike. On a computer
the bar over it reads Ladder | Grid · GEX | VEX · View options, with one
line under it saying what is drawn (±10 strikes · nearest 3 expiries · per
contract) and anything not at its default. View options narrows to
±5/10/20/30/40 strikes or shows all of them, and holds the expiries and slices,
OI / OI + flow and the reading aids. Replay, under the board, is one
button; it opens the replay and stays open while one runs.
The curve is sharp: walls light up, small cells fade back (numbers still
printed), and the 0DTE ladder and the Price chart's gamma dots share the scale.
Dollar figures, per contract (100 shares) or per share, in Settings ›
Display › More display options, changes only how figures are written, never
the walls, the MELT or the regime. Per contract is the default, and the one
switch moves every gamma figure at once — the tiles, the cells, the
0DTE and Charcuterie ladders, Market, the side boxes and Heat — each labelled
with its unit.
On a phone every board is laid out for the phone: one column you
scroll, with each chart and table as its own piece under a small header that
stays in view while you read it (the name, what it shows and its time, ET).
Here, a line of key numbers sits on top — PULSE, the regime, NET GEX and the
levels that fit — and a tap on it opens PULSE and the nine tiles. Under it is
one bar: Ladder | Grid, GEX | VEX and Filters (the strike window, how many
expiries or a slice, OI / OI + flow and the reading aids; the unit and the
colours are in Settings › Display). Then the ladder or the grid at its full
height: ten strikes either side of price, with More strikes at each end,
and under it the Price chart, folded to one line, Price · 30m candles,
until you open it (it stays open once you do), with CHEDDAR, MELT, BLUE and the
kings drawn as lines. The grid opens on the three nearest expiries;
with more, it scrolls sideways on its own while the strikes stay put and its
dates stay over their columns. The dates before expiry, your levels and the
notes follow. Turned sideways, it is the same column. Tablets and computers
keep the board as above.
Look for: which column holds the size. If this Friday owns
all the gamma, this Friday is steering the tape and next month is noise.
Common mistake: reading a far-dated strike as a level
for today. Gamma concentrates violently into the front expiry as it nears.
THE CHEESE BOARD · Handbook
3 · The boards, one by one (continued)
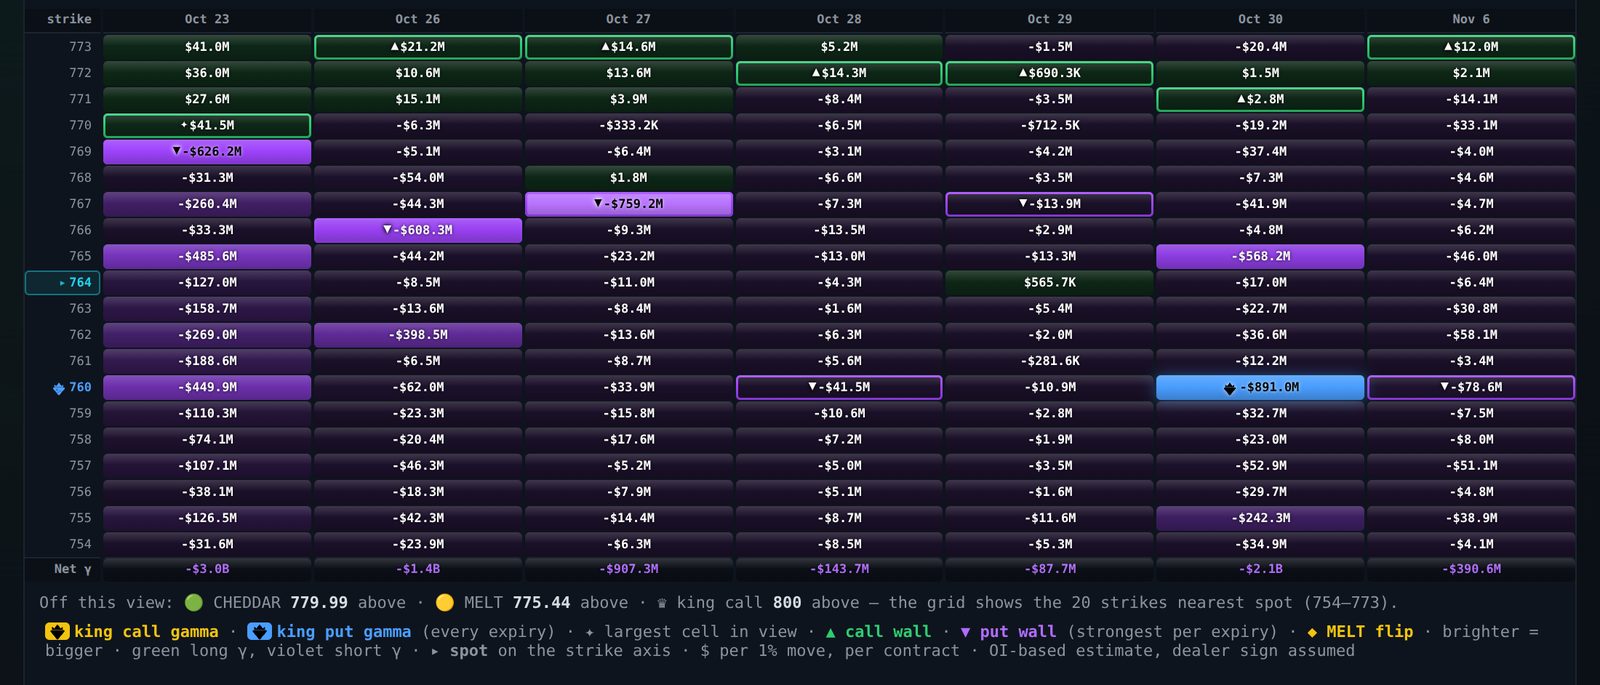
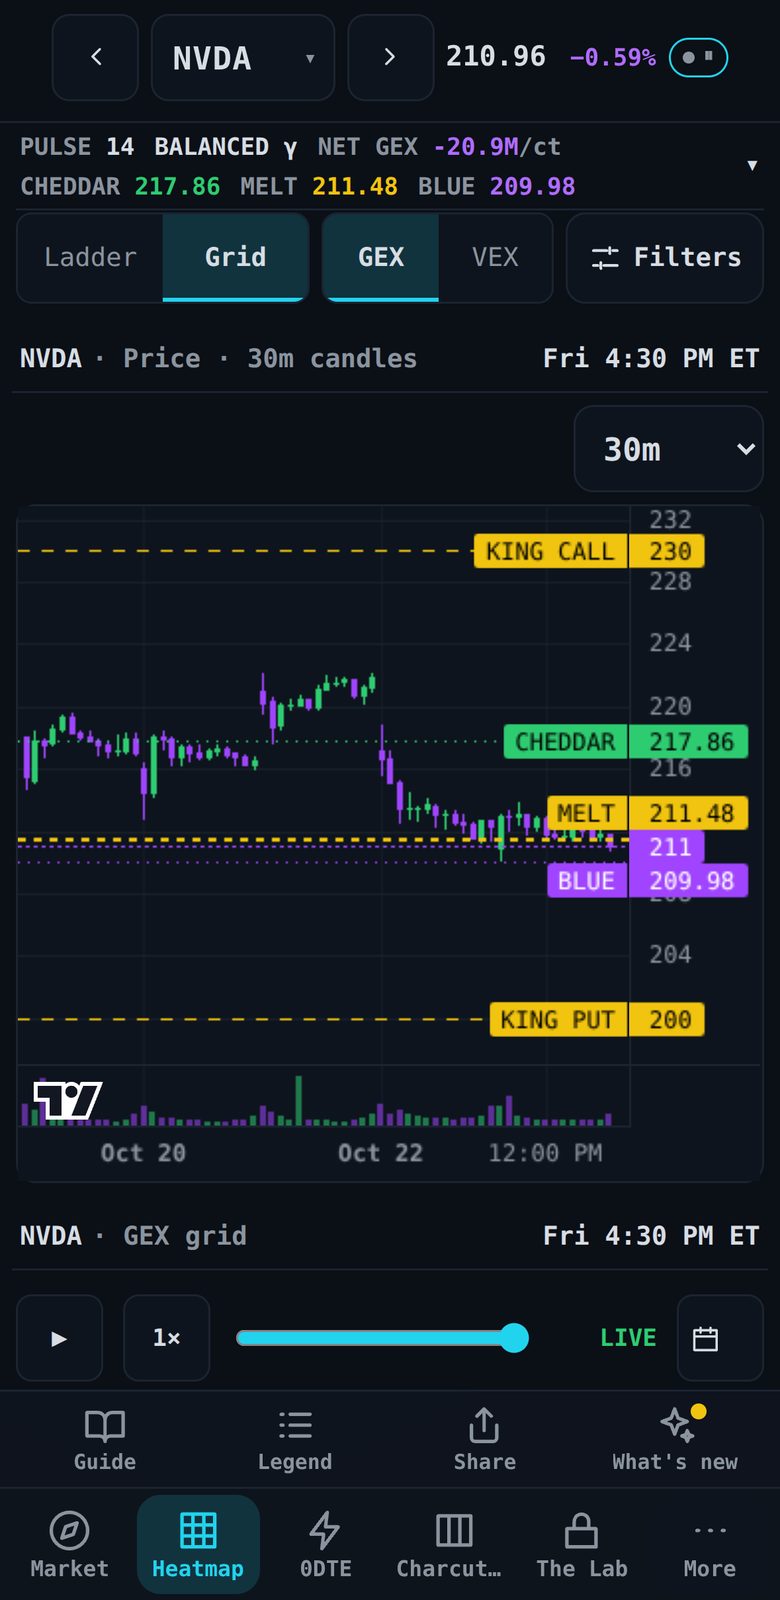
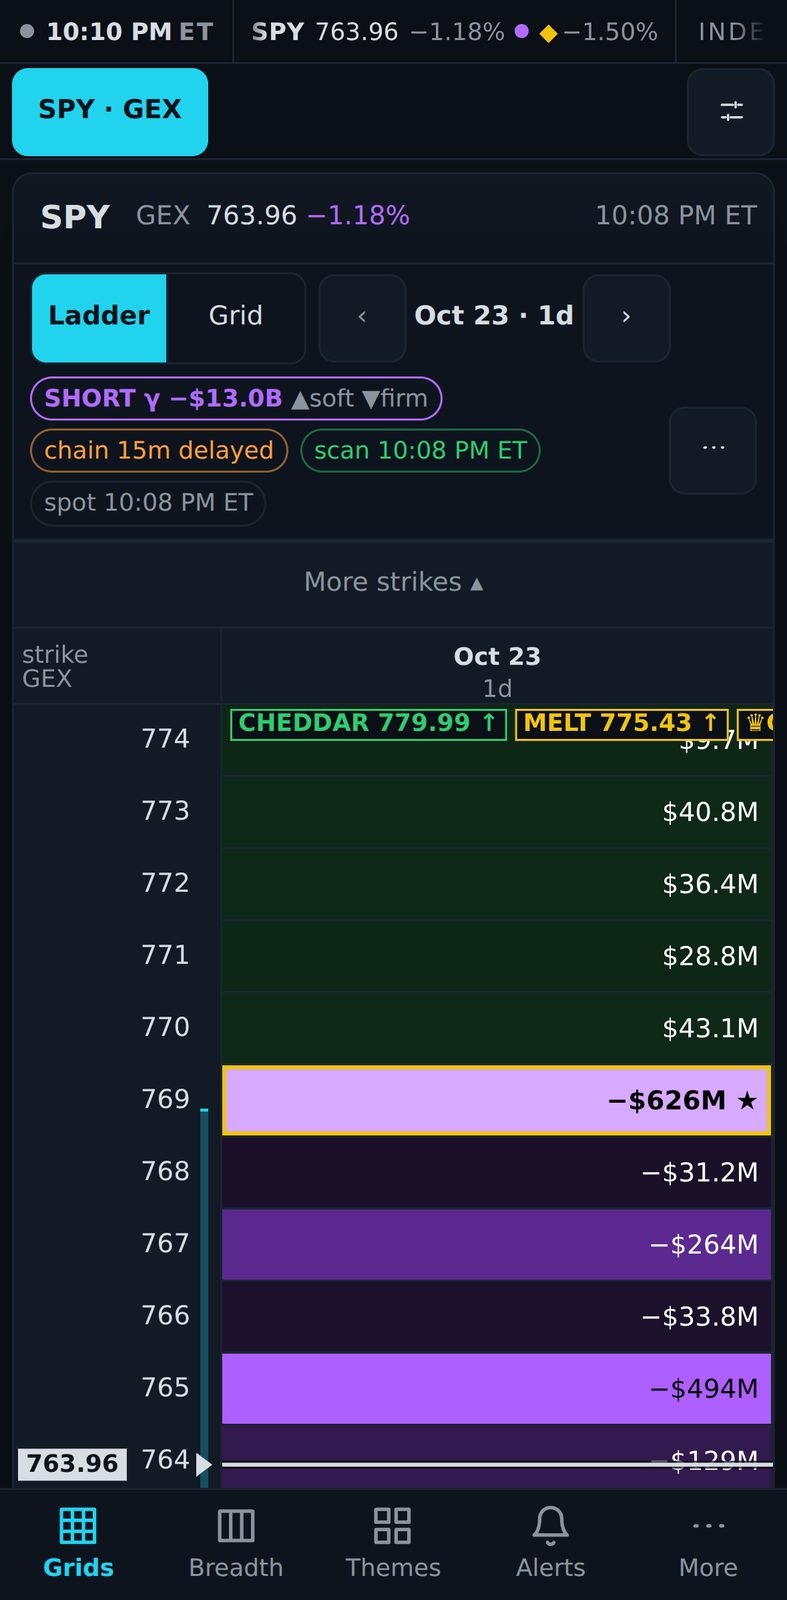
SPY's Heatmap Grid. The 20 strikes nearest price (754–773) across the nearest seven expiries, Oct 23 to Nov 6, brighter for bigger. ▲ and ▼ mark each expiry's call and put wall (✦ instead where that cell is also the largest of its colour in view, as Oct 23's 770 is), the ♛ put king sits at 760, and the line under the grid names the levels outside this view. CheeseAI · real session, Thu, Oct 22, 2026, after the close.NVDA's Heatmap on a phone, taken before v2.0, when a strip of Guide, Legend, Share and What's new sat above the bar (Share is in More now, the guides, the Legend and What's new in Help, and the bottom of the screen is one row; since v3.0 a phone opens the Heatmap on the Ladder, the Price chart folded under it). The name row on top (‹ › step through the names), the line of key numbers (PULSE, the regime, NET GEX per contract and the levels), one bar for Ladder ⇄ Grid, GEX/VEX and Filters, then the Price chart with CHEDDAR, MELT, BLUE and the kings drawn across, the GEX grid's heading and replay bar under it (the grid itself is a scroll further down). At the bottom, that strip, then the bar: your first boards, The Lab (locked on CheeseAI; a tap says what CheeseAI+ adds) and More, which holds every other board. CheeseAI · real session, Fri, Oct 23, 2026, after the close.
THE CHEESE BOARD · Handbook
3 · The boards, one by one (continued)
🟩 Heatmap · today's flow and what lands before expiry
OI / OI + flow. Open interest is settled overnight, so a position opened
this morning is invisible to the plain map until tomorrow — and on a busy
same-day expiry, that is most of the positioning. OI + flow (on the Heatmap
and 0DTE boards) adds an estimate of today's new positions: open interest plus a
share of today's volume, with dealers assumed on the usual side. Volume can't tell
an opening trade from a closing one, but the next morning's open interest can, after
the fact: the share is measured per name, as how much of its volume showed up as
new open interest over its recent sessions. Until a name has a few sessions on
record it is an assumed half, and the note under the grid says which, and how many
sessions it rests on. The same note names where today's trading added the most gamma,
calls and puts. It is still an estimate — a measured share nets each contract's
closes against its opens, and it doesn't know who bought — and it only changes what
the cells show. The walls, the MELT, the regime and the projected close always use
open interest.
📅 Before … expiry. Under the tiles on the Heatmap, 0DTE and Profile,
a strip lists what lands between now and the expiry the board is reading —
this week's on the Heatmap and Profile, the front one on 0DTE: CPI, jobs, the
Fed and the other scheduled prints, the name's own report (counted by when it
reaches the price, so an after-the-close report on expiry day is not in it),
the monthly expiry, half days and closures. A fund has no report of its own,
so on SMH, QQQ, SPY or DIA it lists the reports of its largest holdings among
the names scanned (NVDA for SMH), dated by when that list was taken.
🗳️ US election (results
overnight) shows for any expiry after election day, not one settling on
it: markets are open, and the result lands after the close. On the Heatmap and Profile it ends
with the range the options price to that expiry, which already has those
dates in it. Dates, not a forecast. When the scheduled prints can't be listed
it says so rather than looking like a quiet week.
THE CHEESE BOARD · Handbook
3 · The boards, one by one (continued)
🟩 Heatmap · colours, aids and expiry views
Colours. Settings › Display › More display options › Heatmap colours
offers Cividis, a colour-blind-safe scale, and High contrast
beside the usual green and violet. Under either, every cell prints + or
−, so the sign of the gamma never rests on colour alone; the 0DTE ladder
and the Price chart's gamma dots follow the same choice, and so do The Lab's
Curves, Rings, Ladder and fan: on Rings, the Ladder's bars and the fan short
gamma is also striped; on Curves it is the area under the zero line, and in
the Ladder's net gamma column the side left of its zero line.
The reading aids, in View options (on a phone, rows of its Filters
sheet), change how the grid reads and nothing else: each
cell as a % of the ♛ king; fade cells under a size you pick (a tap
still reads them, and the kings never fade); centre the view on price or
on the ♛ king; + Monthly, the next one or two monthly expiries past the
nearest seven as extra columns marked M (open interest only); and hide
strikes with nothing in the expiries shown. Your choices follow you to every
device.
Expiry slices — 0DTE, Week (through Friday) and Month (31 days) — sit
beside the 3 / 5 / All counts in View options (on a phone, in Filters), and each
marks its own biggest call and put
strikes with ♔. A slice is a view only: CHEDDAR, BLUE, the MELT, the ♛ kings,
the alerts, the briefs and the track record are always built from the whole
book. Under the controls (on a phone, under the grid), gamma expiring today gives the share of the gamma
within 2% of price that expires today; it counts open interest, so a contract
opened and closed today is never in it. Under the tiles, CHEDDAR, BLUE and the
MELT say how long they have stayed put — held 12 scans · since 9:45 AM
ET — the same count Heat shows.
Beneath that, each level says what today has done to it: touched 2× ·
last 11:40 AM ET (price reached it — counted from each minute's high and
low, within the same distance the alerts use — and left; at it now, in
bold, while price is there), broke above or
below (a minute closed through it; a poke through that closes back is
only a touch; the MELT, a price rather than a strike, says crossed),
held since 9:45 AM ET (reached from one side and not
closed through since) and standing 4 sessions (a wall on the same strike
that many sessions running; 4+ when the run goes back further than the
record does). The state belongs to the strike: when price goes
through CHEDDAR and the wall moves, the line reads 580 broke 11:40 AM ET →
new CHEDDAR 585. A level price has not reached today says nothing. When a
wall or a ♛ king sits on a new strike, one line says why — overnight, open
interest at the old strike settled lower, the new strike grew, or it is about
the same and the book re-priced as price moved (with no earlier snapshot to
compare, only that it moved); during the session it is always
re-pricing, because open interest only settles overnight. Heat, The Lab, the
radar and the morning brief print the same words.
THE CHEESE BOARD · Handbook
3 · The boards, one by one (continued)
🟩 Heatmap · change views and the strike axis
Change, in View options (in Filters on a phone), redraws the grid as
Re-priced (each cell minus the session's first scan: last night's book
re-priced, not new positions), Built today (OI + flow minus OI, an
estimate of what opened today), Δ last scan or Opened overnight: the
settled open-interest change since the session before, each cell priced at
today's greeks — positions opened and closed, not re-pricing and not an
estimate; open interest settles once a day, so it holds all session. A + cell
gained gamma, a − cell lost it, and a cell with no baseline is left empty; the
monthly columns show under Raw only.
On the strike axis of the Ladder and the Grid, a muted bar marks a run of
strikes with thin open interest between CHEDDAR and BLUE — where little
is positioned, nothing more. A dotted strike's newest quote is ten
minutes or more older than the rest of the book's, and its tap says when it
was quoted.
THE CHEESE BOARD · Handbook
3 · The boards, one by one (continued)
🟩 Heatmap · the Level Clock
Level Clock (both tiers, on every name) sits on the Heatmap under the
dates, folded to one line, Level Clock · if price stood still. Folded, it
shows no number; open, it stays open as the board updates. On a name's other
boards, More › Tools for this name › Level Clock opens it in a sheet, and so
does the foot of the full read, in the board's Read sheet. It answers one question: where CHEDDAR, the MELT, BLUE,
the ♛ kings and max pain would sit after today's close, after this week's expiry
and after the monthly expiry, if price stood still. Each of those times is a
session's close, written in ET (4:00 PM ET, 1:00 PM ET on a half day); times that
fall together become one (in the monthly expiry's week, this week's expiry is the
monthly one), and once today's session has closed, the first time is the next
session's close.
A slider steps from Now to the latest time (← and → work too). Under it a
table puts Now beside each time (on a phone, Now beside the time you pick), and
its caption carries the premise: if price stood still at the scan's price, these
are estimates, not a forecast. Now is the board itself, the same numbers as the
tiles. A level about the same as now is muted, one that differs is in the text
colour, and the MELT stays gold. Max pain always names the expiry it is read
from. The net γ row names its price, today's, and reads every time at it, so a
difference between columns comes from contracts leaving or joining and time
passing, never from price; Gone by then counts the
expiries that leave by each time and their share of the gamma within 2% of the
price.
Under the table a few lines say what differs at the time you picked: which
expiries leave by then and how much of the gamma near the price they hold; which
later expiries count by then, as the board would count them then (they are in
today's open interest but not on today's board); which levels rest mostly on
contracts that expire by then; and a report due before the time, since implied
vol is held fixed through it. Not counted yet marks a time that waits for
an expiry the options we read don't reach yet, and says from when it counts; a
time that has passed says so until the next scan; no MELT at this time,
near tie (beside a ♛ king, the next strike holds almost as much) and
none placed mean what they say. How it's built folds the method
under the panel (§5). On CheeseAI+ a last line opens The Lab on that name's Gamma
Terrain at the time picked: the same reading, drawn as a picture.
What it never does. It is today's open interest with time passed, price
held fixed, so positions opened or closed later are not in it: an estimate, not a
path, and not a forecast of the levels. It never moves the board: the levels, the
alerts and the posts stay today's, and the next scan redraws it. It rests while
you replay a session, it is not in Easy mode, and it is left out of a shared
picture.
THE CHEESE BOARD · Handbook
3 · The boards, one by one (continued)
🟩 Heatmap · if price were at…
If price were at… (both tiers, More › Tools for this name on a name's
Heatmap, 0DTE, Profile or Options board) reads the book at a price you choose: type one,
or drag the slider across the scan's band of prices either side of the price
now. It says which side of the MELT that price sits on, how far today's CHEDDAR
and BLUE sit from it, either side, and the book's net gamma there, read off the
scan's own curve of prices: the same reading that keeps the tiles live between
scans, so at the price now it shows the tile's number. A small chart draws the
curve across the band, green long and violet short, with the MELT's gold line,
the price now and yours.
What it never does. Open interest, each contract's implied vol and the
time are held fixed: only the price moves. It is an estimate, not a path and not
a forecast, and it says nothing about whether or when price gets there. Today's
levels stay on the strikes the board has now, and past the band it gives no
reading. It keeps nothing, rests while you replay a session and is not in Easy
mode.
⚡ 0DTE
Everything about the nearest expiry in one place. Check which one you are
reading: expiry cadence differs by name — the index products expire every
session, the most active single names carry Monday/Wednesday/Friday weeklies,
and thinner ones only expire Friday. The expiry column says 0DTE on a
true same-day book and FRONT when the nearest is further out, so read
that rather than assuming. It matters: charm bites hardest on a real 0DTE and
is far gentler two or three days out, and the decay clock only runs on a
same-day book. After the close the card says which session it is reading:
NEXT SESSION, the projected close for the next expiry from the book as it
stands, or SESSION CLOSED, where the day's projection stood, while the
board still holds that day's expiry.
It leads with the
projected close — it starts from the gamma magnet read across the WHOLE
board (every expiry, weighted toward the near ones, because dealers hedge the
whole book and a wall a few days out still pulls, just less than the one
expiring today), then nudges toward the open-interest pin (max pain — only on the day
those options expire; before then it is another day's settlement) and where
charm (decay hedging into the close) concentrates. Its likely range is
sized from the name's own options — its implied move over the time left in
the session — so a volatile name gets a wide range and a quiet one a narrow
one, every range narrows as the close approaches, and it always contains the
current price; it tightens further when net options delta is one-sided, and the
confidence rises when those pins agree (and never above LOW when the strikes
are too far apart for the model to choose between them). Pulled toward names the strikes doing the pulling, so you can
check the number against the board instead of trusting it.
THE CHEESE BOARD · Handbook
3 · The boards, one by one (continued)
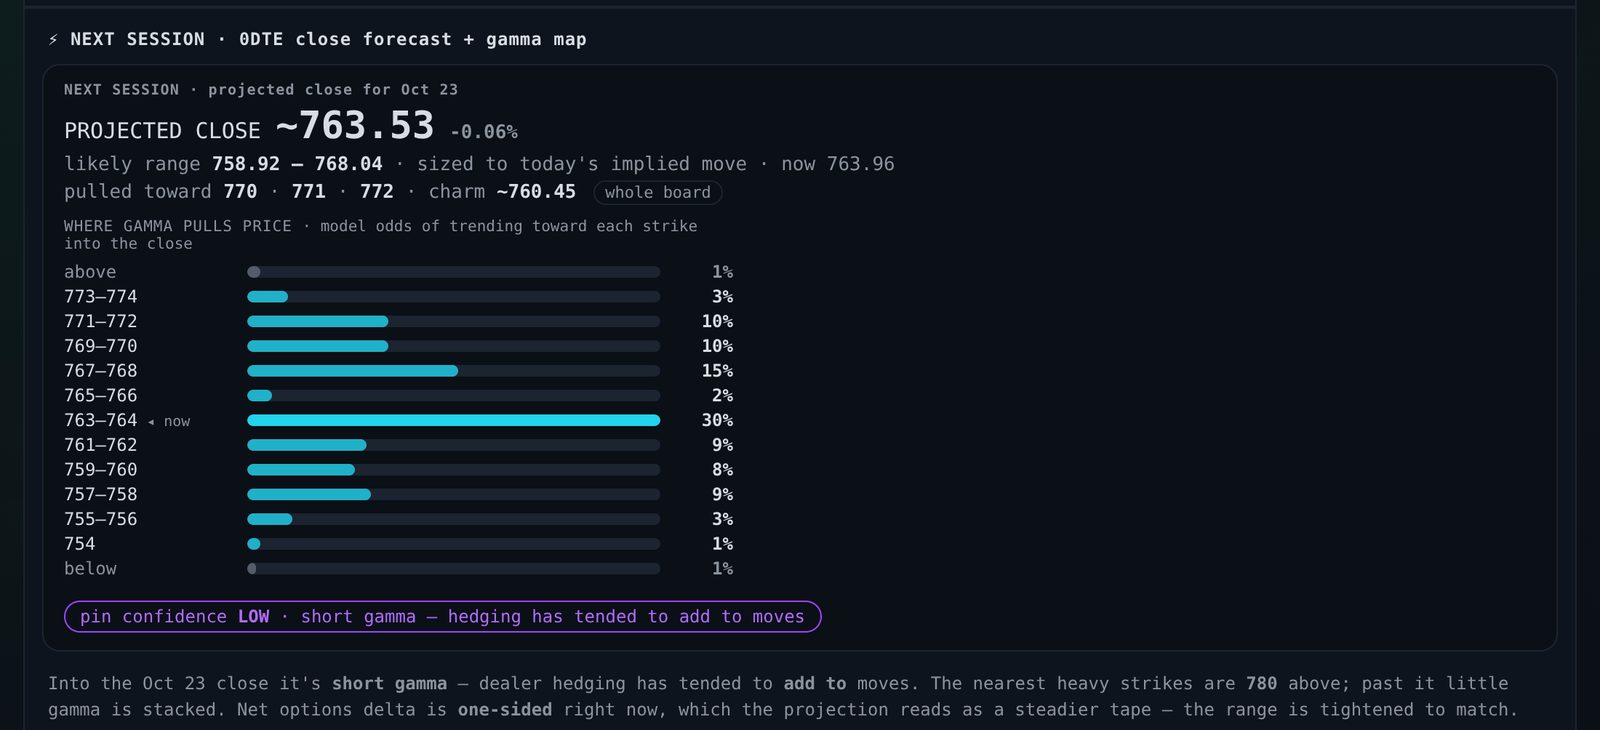
SPY's 0DTE board after the close, reading the next session: the projected close for Fri, Oct 23 (~763.53), its likely range (758.92–768.04), the strikes pulling on it and the model's odds by strike. A model projection, not a target; the one scored is locked at the open. CheeseAI · real session, Thu, Oct 22, 2026, after the close.
THE CHEESE BOARD · Handbook
3 · The boards, one by one (continued)
Where gamma
pulls price on the 0DTE board shows the whole distribution behind the number: the model's
odds of price trending toward each strike into the close, across every strike
that carries weight (neighbours grouped into one row when the span is wide),
with the thin outer tails as "above" and "below" so the column sums to 100%. In short gamma a dead zone can open right
around price (negative gamma pushes it off), though not always: the odds still
gathered at price on the session pictured. It is the move
today's options price, weighted toward positive-gamma strikes and away from
negative ones — a model's odds, not a promise, and read before the max-pain
and charm nudges, so its likeliest strike can sit a touch off the projected
close. Being a projection
for today's CLOSE it stays anchored near spot: it picks between the strikes
price could actually reach, it will not call a move across the board. It is
scored against what actually happened every session, so you can read its record
rather than take it on faith.
A close within a fifth of the name's expected move (at most 0.35%) earns a 🎯
bullseye, a settle on that day's max-pain strike a 📌, and the tightest call,
in its own expected move, is crowned the Sharpest Cheddar on the block. Below that: the single-expiry ladder stacked strike by
strike, and the decay clock comparing the 0DTE book's gamma at the current
price with the open. Under the controls (on a phone, under the ladder),
gamma expiring today is the Heatmap's line from the same scan: today's
expiry's share of the gamma within 2% of price, from open interest, on a day
with a same-day expiry and never in a replay.
Look for: the decay clock through the afternoon. Rising means price sits
on the heavy 0DTE strikes and the pin is tightening into the close; falling means
price has drifted off them and the morning's level has less gamma holding it.
Common mistake: trading the forecast as a price target,
or trusting a 0DTE pin in the last half hour — it's a centre of gravity that
assumes no news, and by then a small move hands the pin to the next strike.
Check the accuracy record first.
🥨 Charcuterie
Several names side by side on the same ladder — 0DTE, This Week, or All
Expiries, in gamma or vanna (GEX | VEX). Built for spotting when the index complex agrees.
A line under the ladders says whether the set agrees: all long gamma, all
short, or split, and how far each name's price sits from its MELT, CHEDDAR and
BLUE in its own typical days. On CheeseAI+, + New can start from a
sector or a theme.
Look for: SPY, QQQ and IWM all showing a wall at the same relative
distance. Aligned index positioning beats any single name.
THE CHEESE BOARD · Handbook
3 · The boards, one by one (continued)
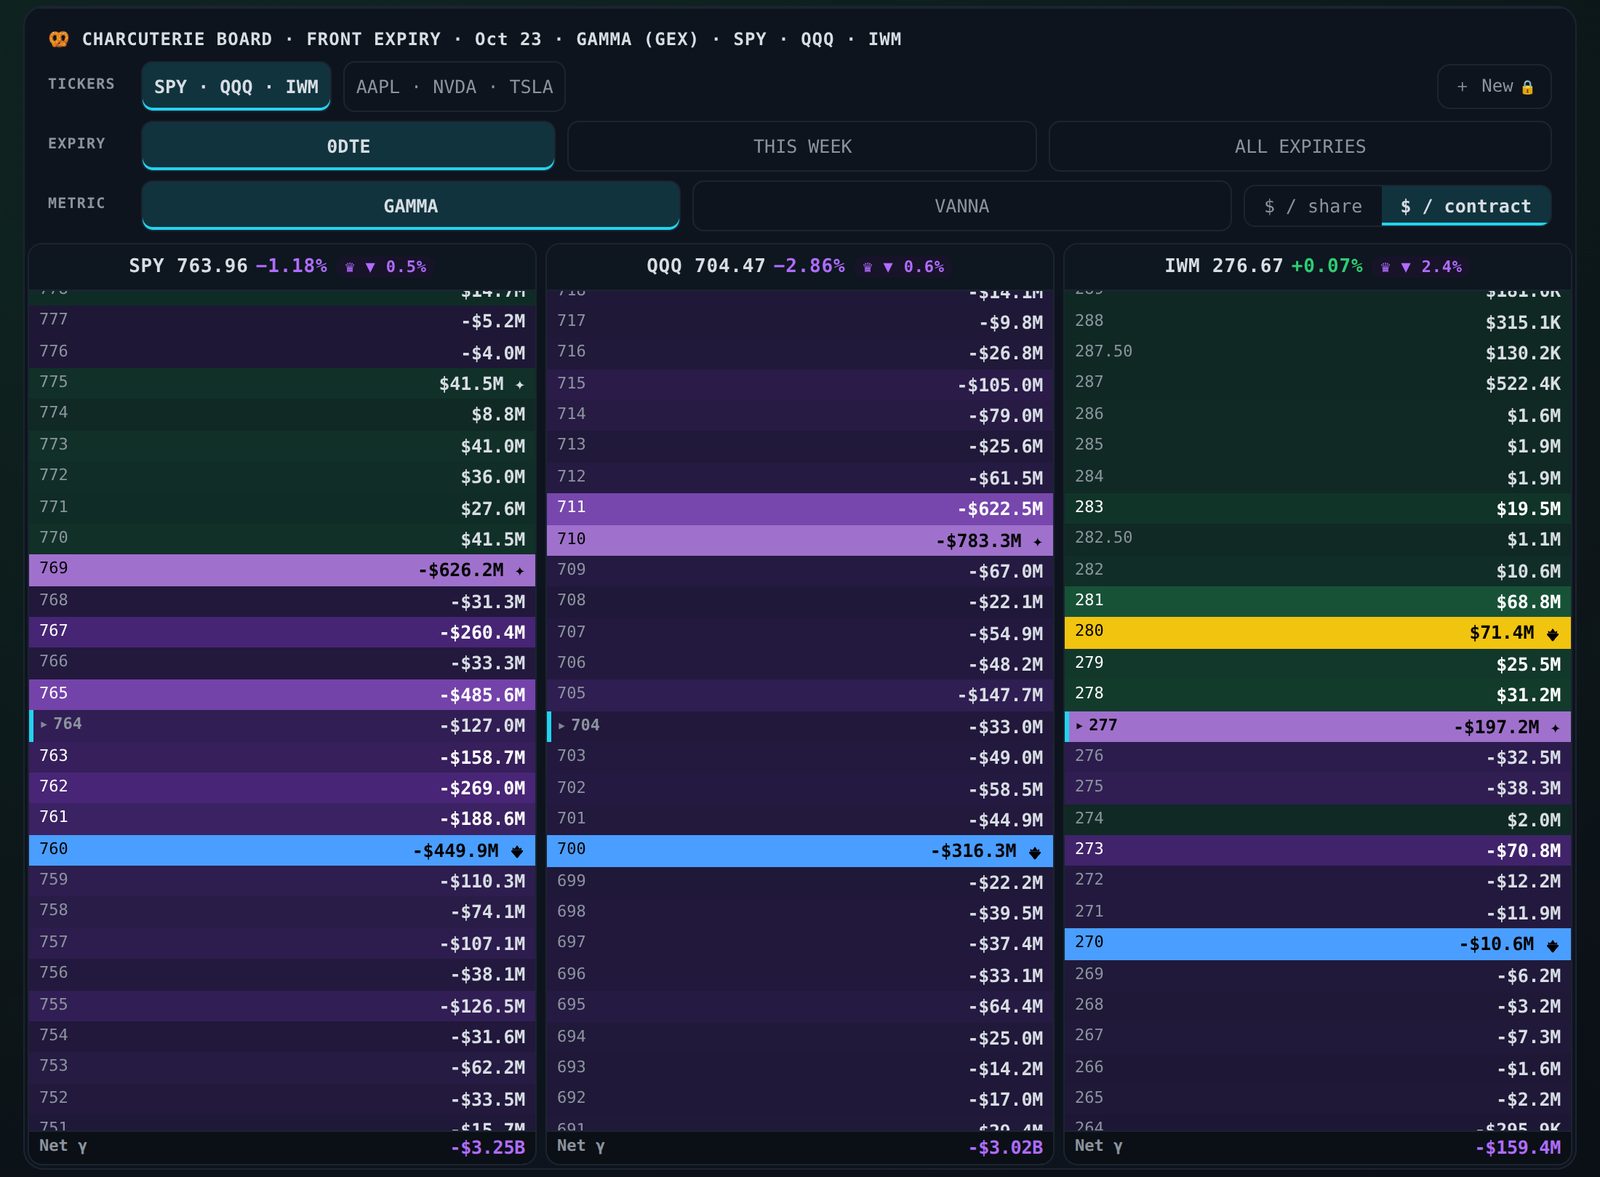
Charcuterie. SPY, QQQ and IWM side by side on the front expiry (Oct 23), net gamma per contract at each strike; ▸ marks price, gold the call king and blue the put king where they fall in view. CheeseAI · real session, Thu, Oct 22, 2026, after the close.
THE CHEESE BOARD · Handbook
3 · The boards, one by one (continued)
📈 Profile
A name up close, on three views (the toggle at the top). Exposure
plots every dealer greek by strike in one chart — gamma, vanna, charm and DEX —
with a cumulative mode that shows which side of the book is heavier (its
zero-cross is a shape, not the MELT — the MELT is drawn as its own line).
Its replay plays today's scans back at 1×, 2× or 4×, with chips that jump to
the open, 10 AM, noon and the last hour. Sessions plays a past session
from the 15-minute record instead — price, the levels and the gamma and vanna
nearest price, a few months back at most — and Practice hides what
comes next, one frame at a time, with a short reading question on each frame
(long or short gamma, the nearer wall, which side of its MELT) that the frame
itself answers. Beside it sets today or another past session next to it
at the same clock time. Nothing is scored.
Price shows candles — 5-minute to hourly across the last few sessions,
or daily — with today's walls, flip and max pain drawn over them, dots
marking where the big gamma strikes sat while price traded, the range the
options market is pricing ahead and, beside it, the range the tape has
actually been realising (detailed further on).
History replays where the walls and the flip have sat session by
session, or through today.
Compare with another name, folded under Exposure, lays the name's
net gamma by strike over another's: its group's fund by default (SMH for a
chip name), else SPY, or any name you pick. Each strike sits at its distance
from its own name's price in that name's typical days (the median day's
move), and each line is drawn against its own biggest strike: compare the
shapes, not the sizes. Each MELT is its own gold line.
Show as a table, folded under Price and under Exposure, lists what the
chart draws: the levels on it with how far each sits from the price, then the
candles, newest first, or every strike with each measure in the unit the
switch sets. It follows the live price, and a screen reader reads it as a
table.
Look for: how steep the crossing is. Near-vertical is a
sharp regime change at one price; shallow is a slow drift.
THE CHEESE BOARD · Handbook
3 · The boards, one by one (continued)
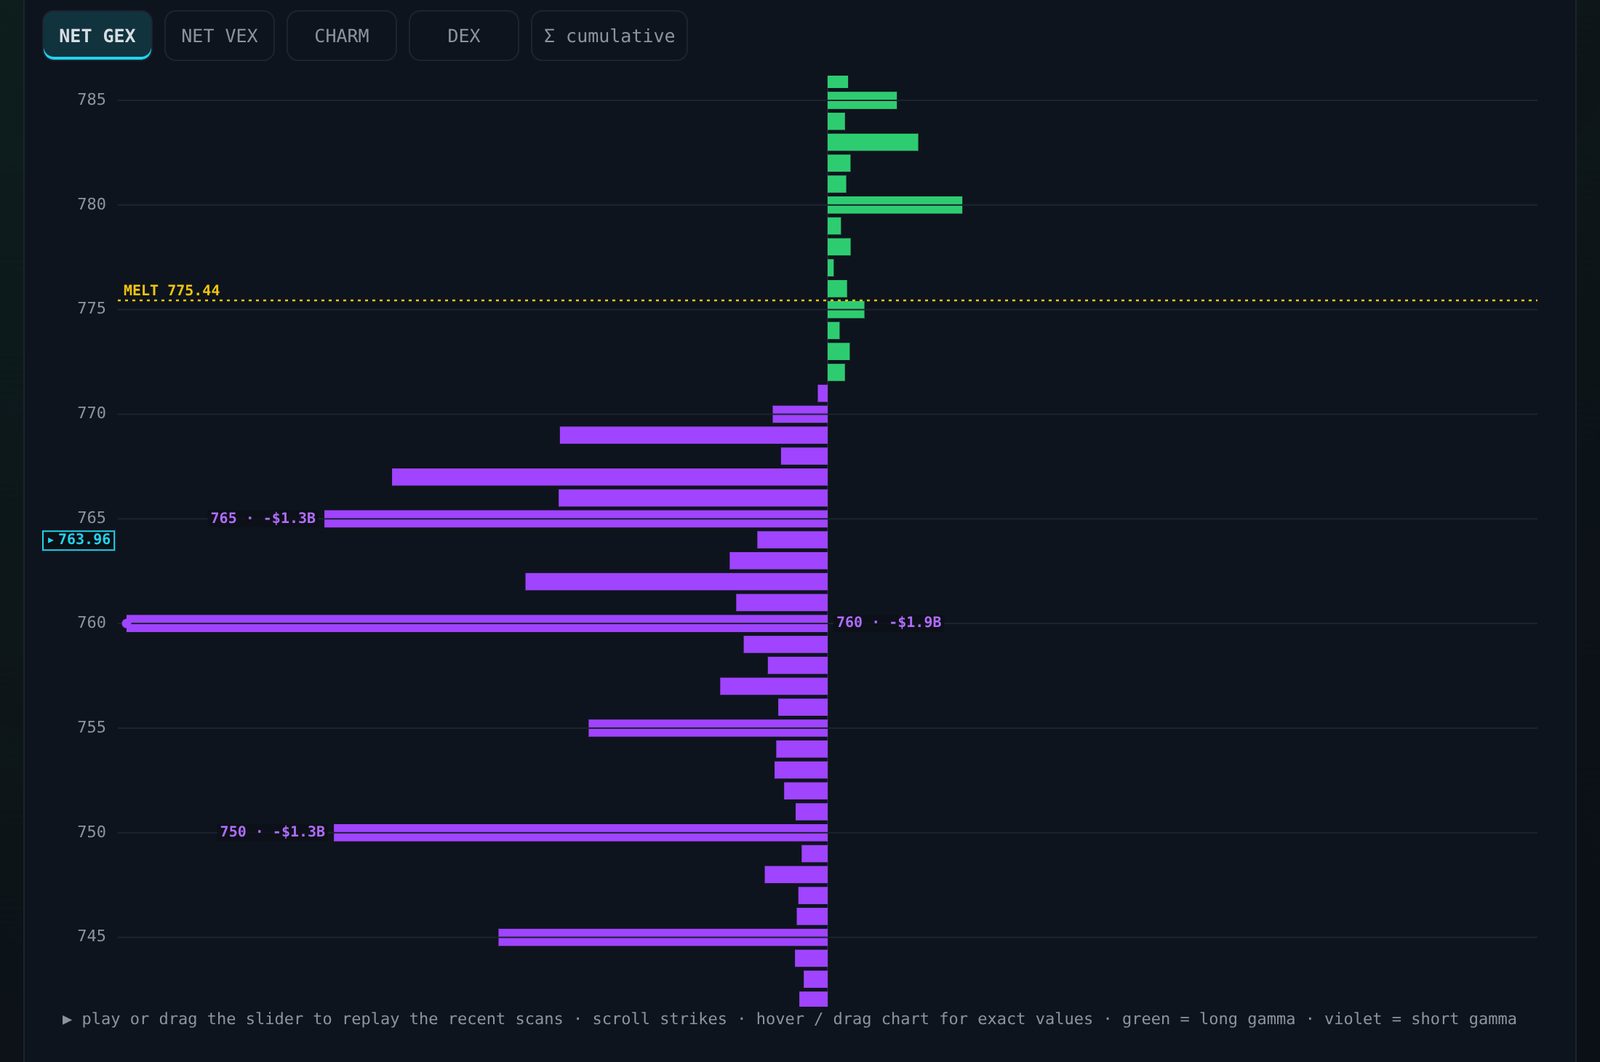
SPY's Profile › Exposure. Net GEX by strike with every expiry added up, the biggest bars labelled and the MELT (775.44) drawn as its own line. CheeseAI · real session, Thu, Oct 22, 2026, after the close.
THE CHEESE BOARD · Handbook
3 · The boards, one by one (continued)
🗓️ Earnings
The names reporting soon, laid out for building a play: the options-implied
move, ATM IV, how dealers are positioned into the print — short gamma
amplifies a reaction, long gamma pins it — and the walls a move would have to
clear. Once a name has a record, its card cites it: how its last print moved
against what the options implied, and its median move over its last
eight prints, the middle of the record rather than a count. Three views: 📋 List ranks everyone reporting, 📅 Calendar lays the month out, and 🔎 <ticker> shows the name you have selected (below).
One thing to know about the implied move: it is only shown when the options
actually list an expiry that reaches the report. Weeks out from a print
that is often not the case — nothing that far forward is quoted yet — and the
board shows a dash rather than the nearest expiry's number, because a two-day
straddle says nothing about a report seven weeks away. What the options do
price by that nearer date is shown beside it, labelled as that date only. The
implied move appears for real once the chain reaches the report, which is
usually a few weeks beforehand.
The read beside it now weighs three things it used to leave out. The implied
move is compared with what the name does on an ordinary day — ±9% is a
different statement on a stock that usually moves 1% than on one that usually
moves 4%. Net GEX sizes the regime rather than just naming it: a book
whose net is a small share of its gross (every strike's net gamma, sign set
aside) is thin enough that one session's flow
can flip it, and the read says so instead of asserting "dealers amplify" with the same confidence at
every size. And the distance to the MELT is stated, because a print that
lands with spot inside one ordinary day's move of the flip can invert the regime
the rest of the sentence just described.
The board also carries a move-vs-implied scoreboard across every
graded print, not just one name: how often the actual move beat what the
options implied, the average of each, and the last handful side by side. It
is the honest read on whether the implied move has been running cheap or
rich lately — misses included, past behaviour rather than a promise.
Some names on the board never appear here, and that is not a gap: an ETF,
a trust or a cash index — SPY, QQQ, IWM, DIA, SMH, GLD, IBIT, SLV — has no
earnings of its own. They carry an ETF or IDX tag where a
stock carries its 🗓️ date, so you can tell "nothing to report" apart from
"no date yet". Their event risk is the macro calendar and the names they
hold: SMH runs into NVDA's print whether or not SMH has one.
Common mistake: buying options into a print without
checking what's priced in. A right-direction call can still lose to IV crush
if the move lands inside the implied band — the name's own record tells you
which side of that bet has been paying.
THE CHEESE BOARD · Handbook
3 · The boards, one by one (continued)
🗓️ Earnings · the calendar
📅 Calendar: tap a day for everything reporting then. Beside each implied move is
the move in the session just before the print: the report day itself for a print after
the close, the session before it for one before the open (a Monday print reads Friday).
While that session is today's and still trading it is the live day %; after the bell it
is the regular-session close. Set against the implied move, it shows how much a name had
already moved before its report, not what the report brings: 0.5× is half of the
implied move. The List's cards and the calendar's cells carry both too. On a phone the month
reads as a list of report days, under a row of its weeks with their counts: tap a week to
jump to it.
🗓️ A name's last eight prints
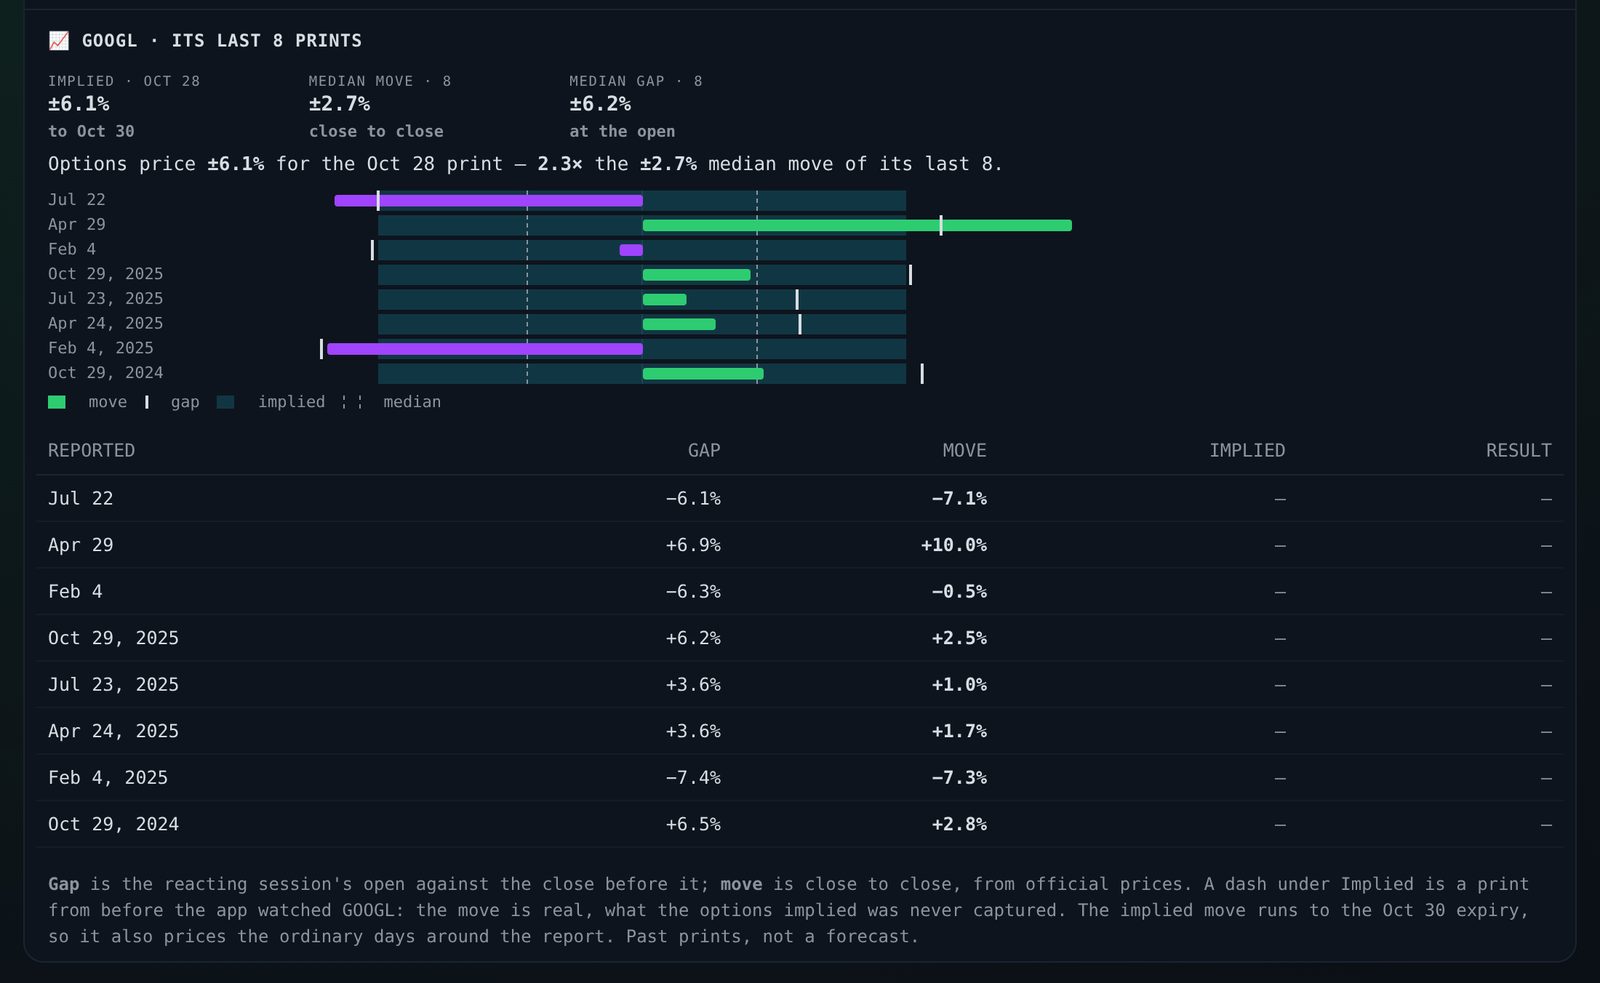
🔎 <ticker> on the Earnings board is the selected name's own card,
then its last eight reports. Each has its gap — where the reacting
session opened against the close before it, the part of the move that happened
overnight — and its move, close to close. The same eight are drawn as one
picture: a bar for each move out from the centre line, a tick for each gap, the
shaded implied move the options price for this print, and the dashed
median of the eight. The tiles above give the two numbers, and when both
exist a line sets one against the other. A print that is out and reacting sits
on top, its move live until the official close grades it. Reports predating the
app are rebuilt from official prices, so the move is real and the implied column
is blank; that figure needed the chain as it stood before a print that already
happened. A date whose reacting session the replay still holds opens that
session in Profile › Sessions. A median is the middle of the record, not a
forecast, and nothing here counts how many prints did what.
Below the record, after each print: the close-to-close move from the
session that reacted to the close three and five sessions later, and the 30-day
implied vol at the close of the session before the report against the session that
reacted, the drop that can leave a right-direction option behind. The vol comes from
the app's own daily record, kept since early October, so it fills in a season at a
time and the table says from when. Then its group on its reports: how each
name in its group moved, close to close, on the session that reacted. Names in a
group tend to move together on a report; this is what each did, not a measured link,
and none of it says what the next report brings. These parts draw once the name's
full record is in.
THE CHEESE BOARD · Handbook
3 · The boards, one by one (continued)
GOOGL's last eight prints, as of Thu, Oct 22: each report's gap and close-to-close move, the medians of the eight (±2.7% move, ±6.2% gap) and what the options price for the Oct 28 report (±6.1%, to the Oct 30 expiry). The Implied column is blank because those prints came before the app watched GOOGL. CheeseAI · real session, Thu, Oct 22, 2026, after the close.
🗓️ Lean, or the premium split
The flow on a card is said one of two ways. When the trade tape read enough
of the name's day (at least $250K of premium and a fifth of the whole), it
shows the Lean: which way that premium was traded, judged by where each
trade printed against the quote — "68% bullish" means 68% of the premium that
leaned was calls bought or puts sold. Names reporting within five sessions get
their biggest contracts read for this. Otherwise it shows Prem · C/P:
where the premium was spent, calls against puts. That is not a
direction — selling calls puts premium on the call side as surely as buying
them — so the read never calls a call-heavy day bullish.
THE CHEESE BOARD · Handbook
3 · The boards, one by one (continued)
🎯 Picks · Today
Today lists the ideas that cleared the Picks rules today — up to
three, no two on the same name or in the same sector group — each on a
real contract from the options chain, with its entry, its target, its cut
and the time it cleared. The rules choose every idea; Cheese AI only writes a
plain-English why and risk under it, checked against the board's own numbers,
and the rules' own words stand whenever that text fails a check. Each card, here
and among Tracked's open ideas, ends with Market at entry: VIX, the index
books and the next scheduled print when the idea cleared the rules. It is a record
of the backdrop, not one of the rules: the rules and the graded record are
unchanged. The idea the
Tracked board opened is always one of them and is graded there; the others
are graded on Today's own record, the same way. Each card, here and among
Tracked's open ideas, also gives its breakeven at expiry: the strike plus
the price paid at the ask, on the stock — a fact about the contract, not a
level the idea is graded on. Most days have few or none, and the board says how
many setups it weighed. That is by design: an idea
needs every rule below to hold, and no idea is better than a weak one, so a
quiet day is the rules working, not the board broken. Folded under the ideas,
How today's setups were weighed gives how many each rule stopped and how
many cleared every rule, beside the five sessions before: counts of setups,
each weighed once, never a rate. Model ideas for study, not advice.
THE CHEESE BOARD · Handbook
3 · The boards, one by one (continued)
🎯 Picks · Tracked
The engine's own model ideas, graded in public. For now there is one
kind: a long after a MELT reclaim — a name crossing back above its MELT
while its book reads short gamma. An idea opens only when every written rule
holds: between 10:00 AM and 3:30 PM ET, on a setup under 15 minutes old; the
cut below the MELT by the name's own stop floor (half the move its
options price over the next couple of sessions, never under 1.5%); the
target the next wall above, between about 1.3 and 1.6 times the distance
to the cut; not already up more than two normal days on the day; a known
report date more than 15 days away (funds have none); no Fed decision, CPI or
jobs report within 24 hours (the dates are on the Market board's 📅 macro
calendar); and a listed call 21 to 45 days out, expiring before any report,
with a delta of 0.40 to 0.65, a spread of 12% or less, real open interest and
an ask under $1,000, that our model says still pays at the target after five
sessions. At most one new idea a day, five open at once, three in any five
sessions and one per sector. Most days nothing qualifies — an empty board
means nothing cleared the rules. On CheeseAI's 12 core names ideas come less
often than across CheeseAI+'s 284.
How an idea ends. It reaches target (one touch), hits the
cut (two updates in a row below it, or once below a deeper backstop),
runs out of time (14 days), or is closed early — before a report,
or when its price stops updating or the board is reset, at its last price or
worse. Target and cut never move. R is the result divided by the
distance from entry to the cut: −1R is a full stop-out.
The record counts every idea since the current settings began, by how
it ended, with the average R from 30 closed — and beside it what random
entries on the same days and the same rules did, which is the yardstick. It
says "too early to judge" until a few hundred have closed. When a setting
changes, the count starts again with a new date and the earlier period stays
listed; the earlier rules keep their own line. Short ideas, wall-break ideas
and new LEAPs are paused while they are graded quietly in the background;
LEAPs already open run to their stated exits. Option est is the named
contract bought at the ask and sold at the mid less half the spread, priced by
our own model — hypothetical, no fees or slippage. Opens and closes post to
the plays channel with the record's counts, and one update after the close
gives each open idea's entry, its model mark and its Option est on one contract;
a Picks alert or post goes out only while the current settings have a graded
record, so no idea is announced without its grade.
Common mistake: counting targets. The 1.3–1.6× window
makes targets common by design; the question is whether the ideas beat the
random entries beside them, and that takes a few hundred.
THE CHEESE BOARD · Handbook
3 · The boards, one by one (continued)
🎯 Picks · the model account
Under the record, the Tracked ideas also read as one $10,000 model
account: each idea buys as many whole contracts as fit
in $1,000 at the ask it opened at, with at most $5,000 — five
ideas — in at once. It shows the account now, cash, money in ideas and net P/L
in dollars and as a percentage of the $10,000, each open idea's contracts,
entry, our model's mark and P/L, the closed ideas, and a line of the account
over time. An idea that comes while five are open is listed as skipped; one
with no option price on record is named and left out, never guessed. It is
rebuilt from the current record period's ideas at the prices each was recorded
at, starts again at $10,000 when a setting changes, and is hypothetical: no
fees or slippage. The record keeps its counts and average R beside random
entries; the account is the same ideas in dollars. In the CheeseAI Discord,
the Cheesy plays tracker channel keeps this account (CheeseAI+'s ideas) as one
pinned message, edited through the session the moment an idea opens or closes,
and at least every 30 minutes; after the close it shows the day's close until
the next session opens. Ideas still open from an earlier record period are
listed in their own section, under the account they opened in, until they
close.
🌊 Options
The day's option activity for one name, two views (toggle at the top).
Activity ranks the traded contracts by premium paid for time value;
OI change ranks the biggest changes in open interest. Activity is what
traded today, OI is what stuck. This is today's contract activity so far,
summed per contract — not a tick-by-tick tape of who bought or sold, only
where the size was.
Two columns are worth knowing. VOL/OI is the day's volume against the
open interest that stood before it: at 1× or more, more contracts changed
hands today than existed, so the strike is being built rather than
recycled. Contracts expiring today or tomorrow are the exception: they are
traded in and out within the day, so their volume says nothing about fresh
positioning and they are never marked as built. SPREAD is the round
trip as a percentage of mid — what getting in and straight back out costs,
and the same figure 🎯 Picks refuses a
contract on. A · in either means the number was not available for
that contract; in the spread column that is "no two-sided quote was listed",
which is not the same as a tight one.
Common mistake: reading big call premium as bullish.
It could be a covered call, a spread leg, or a hedge. Size tells you where
attention is, not which way somebody is leaning.
THE CHEESE BOARD · Handbook
3 · The boards, one by one (continued)
🌊 Options · one contract, each expiry, put/call
A contract's own card. Click or tap anywhere in a contract's row in Activity
or OI change (with the keyboard, its name; on a phone, open its row, then Read this
contract) and one contract is read from its
own numbers: the time left to its expiry's close in ET, the price it is read at
(the day's average, or its value at its own IV where the row carries none, said
so), its breakeven at expiry (the strike plus the price for a call, less it for a
put), delta, gamma and theta, the odds the options price of the stock touching
the strike before that close, and where the strike sits among CHEDDAR, BLUE, the
MELT, the ♛ kings and max pain. The greeks are Black-Scholes at the contract's IV
and the live price, no dividends, the board's own rate. It is for study: nothing
is chosen for you, and it is not a recommendation.
What each expiry prices (folded, above the table): each expiry on the
name's curve with the time left to its close, its at-the-money IV and the range
it prices from the price now, about 68% of outcomes inside it. A price, not a
forecast: an expiry the name's next report lands before carries the report in
its price, and its row says so. Beside it, that IV by expiry against the VIX
index curve: a curve that rises with time is the ordinary shape.
Max pain for each expiry (OI change, folded): each expiry the Heatmap
shows, with the strike where its options would pay out the least in total if
it settled there (the MAX PAIN tile's is the nearest expiry with real open
interest). Pick one for its open interest by strike, puts against calls,
and what it would pay at each strike; All expiries is the open interest
alone. A settlement figure for one expiry, from open interest — not where price
goes.
Put/call volume on Activity is the day's puts traded for each call, by
contracts, set against the name's own last 60 sessions on record, kept after
each close: how many it is higher or lower than, and their middle. Counts, never
a rank: context, not a signal, since puts are bought as protection as well as
for a view. Each app keeps the record for every name it scans; on
Market › Vol, SPY's sits beside its daily record the same way.
THE CHEESE BOARD · Handbook
3 · The boards, one by one (continued)
The Cheese Wheel
A study sheet for the wheel, an options strategy, one name and one turn at a
time: sell a cash-secured put; if it's assigned, own 100 shares; sell a
covered call on them; if they're called away, you're back to cash. Open it
from More › Tools for this name on a name's Heatmap, 0DTE, Profile or Options board.
It isn't on the Earnings board, in Easy mode or in a replay. Both tiers, each
on its own names (§6).
It opens with nothing chosen but the monthly expiry. You pick where to start,
with cash or with 100 shares, then tap a strike on the ladder of strikes
listed for that expiry. Today's levels and the price sit between the strikes
as marks, never as choices. The guides of those four boards name it too, with
where to open it.
A SAMPLE turn (made-up figures, not a quote). Selling this put obliges
you to buy 100 MARA shares at 6.50 if it's assigned, at any time up to its
Fri, Dec 4 expiry.
Premium (SAMPLE)
Worst case
+$5.00 · 0.05 a share × 100 shares
−$645.00 · if MARA went to zero: 100 shares bought at 6.50, less the premium
MARA at expiry
What happens
Result, one contract
9.30 · one priced move up
expires; the premium stays yours
+$5.00
7.12 · unchanged
expires; the premium stays yours
+$5.00
5.45 · one priced move down
assigned at 6.50; the shares are worth 5.45 each
−$100.00
4.17 · two priced moves down
assigned at 6.50; the shares are worth 4.17 each
−$228.00
0 · zero
assigned at 6.50; the shares are worth nothing
−$645.00
SAMPLE: this premium is a round number, a hundredth of the strike, not a
quote. It says nothing about what this contract pays.
For study: not a recommendation, not an order, and nothing you choose is kept. Selling options can lose far more than the premium.
THE CHEESE BOARD · Handbook
3 · The boards, one by one (continued)
The Cheese Wheel · what each turn shows
Each turn leads with what selling it obliges you to do. Then two boxes of the
same size: the premium, and the worst case if the stock went to zero. Below
them: a few prices at expiry (one and two priced moves, then zero), the range
the expiry's own options price, where the strike sits against today's CHEDDAR,
MELT and BLUE, and a report inside the contract's life when there is one.
The premium is the bid for the strike you tap, read at that moment. A quote
that can't be read fairly is refused, and says why: an adjusted contract, no
bid, one side only, a crossed or wide quote, a figure that isn't a price, a
bid out of line with the stock, a quote from earlier, or no fresh stock price.
Under each turn, a line from the Level Clock: where CHEDDAR, the MELT and BLUE
would sit at its latest time on or before the contract's expiry, if price
stood still, with price, open interest and implied vol held fixed.
THE CHEESE BOARD · Handbook
3 · The boards, one by one (continued)
📏 Range Finder
Each name's range for the session, in one plain table. The upside and
downside sit one standard deviation either side of the name's last close,
worked out from that close and a volatility figure: close × vol ÷ 100 ÷ √252. The
2 SD columns are twice that, and the week's range runs from the last
Friday close (the week's last session when Friday is a holiday). The day's ranges
are worked out once after the close, from the settled close, and stay the same all
the next session; the week's are worked out after Friday's close and stay all week.
The vol: VIX for SPY and SPX, VXN for QQQ, RVX for IWM and
GVZ for GLD; any other name its own 30-day at-the-money implied vol, and where
that is missing, how much it has actually moved over the last 20 sessions. The Vol
column says which one a row used.
Beside the range: Position, where the live price sits in it (0% at the
downside, 100% at the upside; under 0 or over 100 means price is outside it);
Hit 20 and Hit 60, how many of the last 20 and 60 sessions closed
inside their own 1-day range, as a share and a count (a session with no vol on
record is left out, and the count says so); the session before's high, low and
close; and Pre-open H / L, the high and low of the app's own price checks
before the open (a dash when there were none). On a phone the table keeps Ticker,
Last, Upside, Downside and Position; tap a row for the rest.
SPX has no live price of its own here: its range comes from the index's own close
and VIX, and its live price is SPY's times the ratio of their last closes, marked
via SPY. The chips over the table are the session's events: CPI, jobs, a Fed
day, the VIX expiry, the monthly options expiry and an index's large holdings
reporting. On those days SPY's and SPX's rows add a second line, the range from the
1-day VIX.
The board starts with SPY, SPX, QQQ, IWM, GLD, SMH and DIA. On CheeseAI+ you can
add up to 20 names of your own, even names the app doesn't scan, and ✕ takes one off;
they are saved with your account. When price reaches a range edge, comes back inside
after one, or closes outside it, an alert says so once that day, and at 9:00 AM ET on
a trading day one push lists the session's ranges (Settings › Alerts › Also send
me › Premarket ranges).
Common mistake: reading the range as where price is headed.
It is arithmetic on a close and a volatility figure, a price, not a forecast, and
closes land outside it.
THE CHEESE BOARD · Handbook
3 · The boards, one by one (continued)
🔔 Alerts
Every alert from today's session and the one before, newest first — level
crosses, wall relocations, max-pain shifts, regime flips. A cross is logged as
price clears the level, not at the next refresh — by a small band sized to the
name, so a price resting on a level doesn't fire it again and again. This is the complete record for those
two sessions; the Discord channel is the short list, and what reaches it is
deliberately narrower than what lands here.
Chips at the top keep one kind (MELT, walls, regime, max pain, setups, picks,
calendar, ranges and, on CheeseAI+, your levels, radar, flow and filings), each with how
many there are. The session menu beside the filter opens any of the 20 sessions
before those two, newest first, and Show older reads back a page at a time;
your own level, radar and flow alerts stay for the last two sessions.
On your phone. Each alert reads as one plain line: the name, the level, its
price and where price was, with no emoji ("SPY crossed MELT 580.00 upward at
581.20."). MELT crosses, regime flips, setups, Picks, calendar notices, Range
Finder's alerts and its 9:00 AM ET ranges, and on CheeseAI+ your levels and
offerings, buzz your phone. Wall breaks, walls moved and max pain are all still on
this board; on CheeseAI+ they buzz your phone once switched on, and the rest can be
switched off, in Settings › Alerts.
THE CHEESE BOARD · Handbook
3 · The boards, one by one (continued)
In the Discord alerts channel. Each post is the same one line your phone
shows, and its title opens the board. A setup reads "SPY long setup: trigger …
Invalid …", with no target. Range Finder's alerts and its 9:00 AM ET ranges post
there too, for the starting rows only. Wall breaks, walls moved and max pain are
not posted there; they stay on this board.
One exception, and it is deliberate: the dated calendar notices below
are written for a particular day — "CPI tomorrow", "FOMC decision at 2:00 PM ET" —
so they stay for that day and leave the morning after. Keeping them would mean
the top of this board telling you a print is coming a week after it landed. The
level crosses are history and stay: the two sessions here, and the 20 before
them in the session menu.
What the channel carries is the calendar: inflation prints (CPI, PPI,
PCE), the jobs report, the Fed's rate decision, market closures, half days that close at 1:00 PM ET,
monthly and quarterly expiry, and quarter end — the evening before, and again
on the morning, each as one line. On this board each one also says how dealers
are positioned going in, because whether the index is pinned or unstable into a
print is the difference between a reaction that gets absorbed and one that runs.
Once a release is out, the
channel posts the printed number too (CPI, PPI, PCE, jobs, retail sales, job
openings, GDP), but only after the official series itself has updated. It is
the figure as published, never a forecast or a consensus, and a number that
has not come through by the close is left to the wires. When the Fed or the
ECB changes its rate, the new rate is posted once, when the official series
shows it.
Beyond the short list of alerts, an ordinary session adds one post an hour,
from 10:00 AM ET until the last hour: the names actually moving, and where their
levels sit.
Expiry is the one worth reading. Everything on these boards is built
from open interest, and on the third Friday a large slice of the open interest
behind your levels stops existing. The walls and the MELT are rebuilt on what
is left, so a level that held for weeks can move overnight without the market
having changed its mind about anything. Quarterly — March, June, September,
December — is the heavy one.
THE CHEESE BOARD · Handbook
3 · The boards, one by one (continued)
The market line. Under a MELT or wall cross, a regime flip, a setup and a
calendar notice, a second muted line gives the backdrop when the alert fired: the
name's next report if it is within about two weeks ("Reports Thu after the close"),
today's or the next session's scheduled print ("Jobs report Fri 8:30 AM ET"), VIX
and its band (calm, normal, nervous, fear: 🌡️ Vol's own), and SPY's book against
its MELT, with SMH for a chip name or QQQ for a big-tech name. On CheeseAI+ a chip
name's line can also count the semis the board reads: how many are long gamma and
how many short. It shows on this board, in Heat's alerts and at the end of the
phone notification. A part the board cannot vouch for — a VIX quote from before the
last session, a board past its usual pace — is left out rather than guessed. The
line describes; it never holds an alert back, and it carries nothing about option
flow. Days are written as weekdays, so a line read the next morning still says the
right day.
On CheeseAI+ the board also carries 🔖 your levels: price crossing a price
you marked, ↑ or ↓ — yours alone, never posted to Discord. Chop across your
level is one alert, and the same level the same way won't buzz you twice
inside twenty minutes. Your 📡 radar alerts and 💥 flow
pushes land here too.
It is not a tab. The record is something you go and check rather than a
board you work from, so it lives under More › Your day › Alerts, always
listed, and on a day nothing has fired yet it says so. A push alert opens it
directly, on the name that fired; a 🎯 Picks alert opens Picks. Alert times
are ET, like every time in the app.
Look for: a wall relocation. The level everyone was watching
just moved, which often precedes a change of range.
THE CHEESE BOARD · Handbook
3 · The boards, one by one (continued)
🔔 Alerts you can check
Settings › Alerts › Send a test sends one alert to the phone in your
hand, and the app says confirmed only once that phone reports the
notification on screen; a test the phone never confirms says so, with what to
check. A test you ask for comes through even in your quiet hours, and the answer
says when real alerts are being held until they end.
Your devices lists every device with alerts on: what it is, when the
app was last opened on it, the last alert sent to it and the last one it
confirmed. A device that refused an alert says so, and you can stop alerts to an
old phone from any other device. Alerts pause on an account that has gone
unopened on every device for a long while; opening it anywhere starts them
again.
Held alerts. When an alert was not sent to your devices, the Alerts
board says why: your quiet hours, a name you muted, a kind you switched off,
Only my watchlist names, or a device that was paused or refused it.
Show hidden brings back the alerts your own settings keep off the board,
each with its reason. Between scans, every name sitting near one of its levels
is checked on the live price; a cross that the next scan caught instead is
marked Checked at the next scan, with the reason.
THE CHEESE BOARD · Handbook
3 · The boards, one by one (continued)
🧀 The Cheese AI read
A CheeseAI+ feature. On CheeseAI+, tap Ask Jack (🧀: on a phone
beside the name on a name's board; under More › This screen whenever that
button is off the screen, as on a computer) on any name and you get one thing: a plain-English read of that
name's setup, written from the numbers on these boards and nothing else. No
news, no price targets, no opinion about the company — the same walls, MELT,
max pain, net GEX and implied move you can see for yourself, in sentences.
In 🧪 The Lab, the Jack's read card has an Ask Jack door that opens it
on the name you have open.
It ends with a Cheese call and a conviction out of 100. The
conviction is how clean the setup is, not a probability and not a
promise. Every call is graded against the next session's close: right or wrong
only when the name moved at least a quarter of a normal day, counted beside
what saying "higher" every time would have scored on the same calls. On a
balanced book, or with a report due before the call is graded, it says
no call. Ask Jack for a play and you get that name's graded call for
the session; trade ideas with a contract, a target and a cut come only from
🎯 Picks.
The read is written once per name per scan, so it changes when the levels
change rather than every time you open it. If two readings of the same name
look identical, that is because nothing underneath them moved.
New reads and questions are open 8am–8pm ET, every day. Outside those
hours a name you have already read stays open, and you can reread it; only new
ones wait for the morning.
Common mistake: treating the Cheese call as a trade.
It is a description of positioning, worded for a human, and it is wrong
sometimes — which is exactly why the conviction number and the graded record
are printed next to it rather than hidden.
THE CHEESE BOARD · Handbook
3 · The boards, one by one (continued)
🧀 Your own questions
On CheeseAI+ you can also ask it your own questions under the read, in
the same Ask Jack sheet —
about that name's setup, or another name you cover. Answers come from the
same numbers and say so when the numbers can't answer, and each question counts toward the same hourly allowance as a
fresh read. The sheet shows how many you have left this hour, and a name you
have already read opens again even once they're used up.
A question can reach past one name. Ask about a sector — "how are the
quantum names positioned?", or tap a sector chip — and it reads every scanned
name in it. Type /watchlist (or tap ★ My watchlist) and it reads
your saved list: the 15 names nearest a flip, a print or a big move get
their levels, and the rest are named. /screen runs one of the Market
board's lists across every name — near the MELT, short gamma, reporting this
week, Dips, Unusual — and type / in the box for the full menu. These
answers open with the list of names they read, and talk about those names in
distances from spot rather than prices; open a name on the board for its exact
levels.
One question is written at a time; up to two more wait their turn. The
bubble counts the seconds. Stop waiting lets go of the wait, not the
question — it still counts, and if it finishes it appears in your chat. If a
question fails on the way, Retry asks again without charging you twice.
Expiries, above the box, picks which expiries Jack reads for every
name an answer covers, one you name or each name of a sector, a /screen or
your watchlist:
Today (the session's own expiry, or the next session's after the
close), This week (through Friday) or This month (the next 30
days). Each answer says which expiries it was read on, with the dates, and
every number in it is checked against those expiries' figures. CHEDDAR, BLUE,
the MELT and the kings stay the full book's, as on every board. Ask about a
finished session (“how was SPY’s book last Tuesday?”) and
Jack reads that session’s record instead: its range, its levels as it
opened and as it closed, and how it went against the levels it opened with,
in the words the levels pages use, with every number checked against the
record. It says what happened that day, never what comes next. Under each
answer, Copy takes it as plain text, and Flag sends it with your
question to the team as a wrong number, a wrong level or unclear. Flags cost
nothing.
THE CHEESE BOARD · Handbook
3 · The boards, one by one (continued)
🔥 CheeseAI Heat
A CheeseAI+ feature. On a phone it is 🔥 Heat in the bar at the
bottom of CheeseAI+, and it opens inside the app; on a computer it opens from
the app menu at the brand (CheeseAI+ ▾), and heat.cheeseai.app serves a
computer or a second screen. Heat is the Heatmap made full-screen: the same strike ×
expiry grids, built from the same scan, for up to nine names at once. Pick
1, 2, 3, 4 or 9 panels, or start from a ready layout — Index four
(SPY, QQQ, IWM, DIA), Mag 7 + indexes, Single + tape (one name
beside its chart: 5-minute candles over the gamma at each strike through the
day) and Index three (SPY, QQQ and IWM ladders, each above its chart, on a
wide screen), 0DTE ladder + tape (SPY's same-day ladder with its chart
under it) and My watchlist (your ☆ names). Charts on the top row (T)
puts those candles under the levels on any layout. Tap a name to
change it, save the arrangement as your own layout, or copy a link that opens it
as you left it. Heat is built for a phone too — see Heat · on your phone.
Controls apply to every panel unless you switch them to the focused
one. On a computer the second row keeps Layout, the Measure and the
two windows; View options ▾ beside them holds the rest, each with its name:
the basis, the side, the change view, the palette and Levels, then the scale,
Read as, Dim cells under, the projection, the controls and crosshair switches,
Save layout and Copy link. The top row's gear is Heat's one Settings.
Expiry window: 0DTE, the next expiry, this week, up to a month, or
everything out to 45 days. Strike window: ±10, ±20, ±40 or all. Scale:
each panel on its own, one scale shared across panels (so a quiet name looks
quiet), or locked to a figure you type; Read as dollars or as a share of
the king; Dim cells under a share of the biggest. Three palettes,
including a colour-blind-safe one: Heat starts on the Heatmap colours you chose
in CheeseAI+ until you pick one here; Heat wears your one theme.
Kiosk mode is for a second screen or a stream: the chrome goes, the
screen stays awake, big type is a setting, and it can cycle through your
watchlist or the layout's names. How to read (or ?) lists every
keyboard shortcut; E saves the focused panel as a PNG, Shift + E the
whole grid, stamped with the scan it shows.
THE CHEESE BOARD · Handbook
3 · The boards, one by one (continued)
Heat on a computer, Index four. SPY, QQQ, IWM and DIA side by side in GEX: each a strike × expiry grid from Oct 23 into late November, price drawn across it, and under it the key, the levels with how many scans each has held and the move the options imply. The chip after each regime (cut short here) says this session's option chain ran 15 minutes behind. CheeseAI+ · real session, Thu, Oct 22, 2026, after the close.
THE CHEESE BOARD · Handbook
3 · The boards, one by one (continued)
🔥 Heat · reading a panel
The Measure picks what each cell counts (each board can keep its own,
from its Measure for this board): GEX (gamma, dollars hedged
per 1% move), VEX (vanna, dollars of delta per vol point), Charm
(dollars of delta per calendar day; today's expiry counts what drifts by its
close) or DEX (delta, dollars per 1% move);
or plain Vol (contracts traded today) and OI (contracts open).
Charm and DEX are labelled estimates. DEX keeps each contract's own sign —
calls positive, puts negative — so it says which way the book leans, not how
dealers will hedge it. On GEX you can show calls, puts or the net. Figures are
per contract (×100) or per share, the same switch as the app.
The basis is OI — last night's settled open interest — or
OI + flow, which adds an estimate of positions opened today, exactly as on
the Heatmap board. Cells change once per scan; only the spot line moves between
scans.
Levels (on by default) draw the walls, the MELT and the two kings on
every panel. Each board's footer is one row, CHEDDAR, MELT, BLUE and max pain (two short lines on a phone);
the ⓘ at its end opens the rest under it (the measure and its unit, the
scale, the Σ row, that it is open-interest based and assumes a dealer sign, the
kings, the implied move and held N scans) and closes it again. Held N scans
counts the scans in a row each level has sat on the same strike — a wall that
has not moved all day reads high, one that just arrived reads 1. Ghost dots mark where the kings and the biggest node sat
at earlier scans today, so a level that walked is visible as a trail. The shaded
expected move is the range the at-the-money straddle prices to the expiry
it names: market-implied, not a forecast. Your 🔖 levels are drawn too.
Show as a table (the table button in a board's header on a computer, a
row in its ⋯ on a phone) lists the board as you have it: the strikes in view,
highest first, the expiries, the board's measure and unit, the totals and the
levels on each strike. It follows the price, and a new scan refills it where
you were.
Common mistake: comparing brightness across panels
on the Auto scale. There every name fills its own range, so a quiet name can
glow as brightly as SPY; switch the scale to Shared before comparing sizes
across names.
THE CHEESE BOARD · Handbook
3 · The boards, one by one (continued)
🔥 Heat · what changed
The change views answer "what is different since this morning", and they
keep two very different things apart:
Re-priced since open — open interest is fixed during the day, so
this is last night's book re-priced by price, volatility and time. It is
not new positions: a strike can grow here because price walked up to
it.
Built today (estimate) — OI + flow minus OI: the positions
estimated opened today. Volume cannot tell an opening trade from a closing
one, so this is an estimate and is labelled as one.
Δ since last scan — the change since the scan before, for spotting
what just moved.
⇅ Movers lists the cells — a strike in one expiry — that changed most
across the names on screen, built today and re-priced in separate lists, never
mixed. Tap one to jump to it. They say what changed most, not what happens
next.
THE CHEESE BOARD · Handbook
3 · The boards, one by one (continued)
🔥 Heat · Breadth, Themes and the regime
▥ Breadth is a calendar: each sector a row, each session a column, over
the last 7 or 14 sessions, 3 months, 6 months or a year. Pick a family, then a
measure. Price: the share of the sector's names that closed above their
own 20-, 50- or 200-session average close, or closed up on the day; or 20-day highs − lows, the names
at a 20-session closing high less those at a low, as a net share from −100% to
+100%. Levels: the share that closed above their MELT, which is where
price sat against the gamma flip. Options: the share whose own book read
net long gamma at the close. The last two can disagree — a name can sit above
its MELT while its net gamma is short — which is why they are separate measures.
Levels and Options start with roughly the last three months on record and fill
in session by session, so their longer spans begin partly empty; days filled in
from the archive are footnoted. An outlined empty cell is a session where no
name in the sector could be measured.
◩ Themes puts each theme and sector on a card for one window —
premarket, the first 30 minutes, or the day: its middle move (half its names
did better, half worse), how many of its names are up, how many trade below
their MELT (out of the names with a MELT to compare), the biggest king among
them and the top movers.
The regime notice at the top says whether the market as a whole reads
long gamma, short gamma or balanced — the same read as the Market board's
market gamma line — and when that changed during the session.
Common mistake: treating a weak column of breadth as a
sell signal. Breadth describes how many names are taking part and where they sit
against their levels. It is participation and positioning, not a forecast.
🔥 Heat · the Map
◎ Map, beside Grids, Breadth and Themes, is The Lab's Map inside Heat:
every name at its headquarters, each place shaded by Day move, Gamma
or From the MELT, across the U.S., the world, the Bay Area and New York
(the shades and views are described with The Lab below). On a computer press
Shift + M; on a phone it is More › The Map, and inside CheeseAI+
More › This screen › The Map. Tap a place for its names, and a name in that list
to open it on a board. Turning and the webs stay in The Lab. It groups the board
by home and says what happened, never what comes next.
THE CHEESE BOARD · Handbook
3 · The boards, one by one (continued)
🔥 Heat · Strike Flow
Strike Flow shows the option premium that traded at each strike, calls
on one side and puts on the other, over a window you pick — 5, 15 or 30
minutes, an hour, or the whole day — and a replay that steps back
through today's earlier windows. It covers every name CheeseAI+ scans, on its
nearest expiry, and when there is nothing to show yet it says why. On SPY and QQQ's
15-minute windows, the strikes nearest price are split into bought,
sold and unclassified; other windows and strikes show premium only.
A print above the middle of the quote standing at the time reads as bought,
below it as sold; a print at the middle, or with no usable quote, stays
unclassified and is never guessed or shared out. The panel says what share of
the premium was classified.
It is premium traded, not direction. A bought call can be someone closing a
short; a big print can be one leg of a spread. Read it as where the money is
changing hands right now, beside the positioning the grid shows.
THE CHEESE BOARD · Handbook
3 · The boards, one by one (continued)
🔥 Heat · on your phone
On a phone, tap 🔥 Heat in the bar at the bottom of CheeseAI+: Heat
opens between the app's two bars. To go back, tap the board you came from, on
the bar or in More (or use Back, where your phone has one): it is right where
you left it. For a phone or tablet kept as a second screen,
heat.cheeseai.app added to the Home Screen from Safari is still its own
full-screen app. On a phone, upright or sideways, Heat is one column you
scroll: each board is its table, its levels and its own chart, one under the
other. A bar of chips under the header (SPY · GEX, SPY · VEX) jumps
to a board, and Controls at its end opens the layouts, measures and view
as a sheet from the bottom (it closes once you pick). Its strike select, under
View, is the one strike control: it widens or narrows every ladder to what it
says, and shows the ladder's own window, More strikes included. The regime chip at the top
opens today's changes (on its own Home Screen app, 🔥 Heat ▾ beside it
switches app, and the top rows tuck away as you scroll down). Along the bottom sit
Grids, Breadth, Themes, Alerts and, on its own app,
More (Movers, a picture to share, the charts on or off, kiosk, the Map,
settings and the theme). Inside CheeseAI+ that row ends at Alerts, and Movers, the
picture, the charts, the Map, Heat's settings and How to read are the app's More ›
This screen rows, so there is one More on screen. Nine names also
show as tiles at the top (price, the gamma read, the king and how far it
sits, which side of the MELT) and a tap takes you to that board. On a phone
Breadth turns on its side: days down the page, newest first, the sectors
across; tap a day for its numbers. If you added Heat to your Home Screen before
Thu, Oct 15, 2026, remove it and add it again once: it gets Heat's own flame
icon and launch screen, and the top of the screen stays clear under the
clock.
On a phone each board opens as a ladder: the strikes around the price,
one expiry at a time, with ‹ › to step the expiry and More strikes at
either end. Grid shows every expiry: one finger up or down moves the page,
a sideways swipe moves the grid's dates, and a pinch zooms the whole page,
never one board. Tap any cell
for its numbers, then 🔖 Mark this strike (it becomes one of your levels, on
every board), open the name in CheeseAI+, or see its Strike Flow. On a
computer a click pins the numbers, and a right-click (or Enter on the
keyboard cursor) opens the same choices, and scrolling over a grid's strikes
(or + and −) zooms that grid. Swipe a board's name to change it; its
⋯ goes back to spot (⊙) or the king (♛), resets a grid's zoom (⟲), and holds
your watchlist, your note, replay and Share, which sends the board (16:9 or
1:1) or one board as a picture to Messages, X or Discord. A line under the
regime strip, New to Heat? The one-minute tour ›, offers a six-step
walkthrough read off a real name's levels until you take it or close it with ✕;
it never opens by itself, and How to read's Show the tour again brings it back.
THE CHEESE BOARD · Handbook
3 · The boards, one by one (continued)
Heat on a phone. One board, SPY in GEX, opened as a ladder: one expiry at a time (Oct 23 here) with ‹ › to step through them, its regime chip, when the scan and the price were taken, and the strikes around price with the levels marked; the bar along the bottom holds Grids, Breadth, Themes, Alerts and More (inside CheeseAI+ it ends at Alerts). CheeseAI+ · real session, Thu, Oct 22, 2026, after the close.
🔥 Heat · alerts, replay and your names
🔔 Alerts lists today's alerts — walls moving, price crossing the MELT,
the regime flipping, your 🔖 levels — in plain words, newest first. Tap one to
land on that name and strike. Turn on Alerts on this phone to have them
arrive as notifications (on an iPhone, from the Home Screen app); Send a
test beside it sends one to that phone only, and Heat says when that phone
reports it on screen, or that it hasn't, never assumed. Since you
last looked is a line under a panel when its levels moved while you were
away — a wall that stepped, a king that moved, price crossing the MELT.
Each panel carries its gamma read — LONG γ, SHORT γ or BALANCED, with the
net GEX — a ☆ to add the name to your watchlist (shared with the app; your
names come first when you search), and 📝 for your note on it.
⏪ Replay steps the grid back through today's scans, each frame the board as
it stood at that scan, walls and king included.
Common mistake: reading an alert or a replay as a call.
Both say where positioning sat and what changed. Neither says what price does
next.
THE CHEESE BOARD · Handbook
3 · The boards, one by one (continued)
🔥 Heat · the clock, the ticker bar and a picture
The clock at the top is New York time, labelled ET: whether the market
is in pre-market, open (and how long is left), after hours or closed, holidays
and half days included; when it next opens; the day's next scheduled print, such
as CPI or the Fed; and when today's 0DTE options stop trading. On a phone it
sits at the left of the ticker bar, short (the time, with a dot for the
session); tap it for the rest.
The ticker bar under the header runs the names on your boards, then
SPY, QQQ, IWM and DIA, then the scan's biggest movers: price, day %, a dot for
the name's gamma read (green long, violet short, the same colours as everywhere
else, not a direction) and how far price sits from its MELT. Only the price
number flashes when it ticks. Tap a name to open it; the bar holds still under
your finger and does not move at all with Reduce Motion on.
The opening gap. Each candle panel shades the move from the last
close to the open (before the open, to the pre-market price) and names the level
the open sat at or gapped through, as the levels stood at the open. A wall, the
MELT or a king that price has come within the alert band of is outlined with a
glow, brighter at a touch: it marks where price is, not where it goes.
The projection. Each candle panel carries the 0DTE board's projection
for today: the amber path from the latest scan to the 4:00 PM ET close (1:00 PM
on a half day), its likely range as a fan, the cyan band of what the options
price, and the projected close tagged on the price axis. It is the 0DTE card's
model on the same book, worked out at each scan and marked with that scan's
time; the card keeps re-reading the book as the session runs, so between scans
the two can differ a little. On OI + flow the same model also counts
today's flow as opening positions — an estimate, and not scored — and that line
leads, the open-interest one faint beside it. From 4:00 AM ET it reads the
pre-market book; once the market shuts, overnight included, it shows the
session's last projection beside the close, marked as past, and never projects
a closed market. Where the app shows none (no expiry within a week, a report
before the open, too thin a book) Heat says why. The open-interest line is a
model projection, scored in public — not a target; Projection under
View options (on a phone, Controls › View) turns it off.
Share on the top row (on a phone, a board's ⋯ › Share this board, or
More's picture row) makes a picture ready to post,
16:9 or 1:1: the board as on screen, the names, the date and time of the
data in ET, whether the market was open, a card for each name with its levels by
name, and the line that it is education, not advice. Nothing of your own goes
in it. The single-panel picture is still there.
THE CHEESE BOARD · Handbook
3 · The boards, one by one (continued)
🧪 The Lab
A CheeseAI+ feature. On a computer it opens from the app menu at the
brand (CheeseAI+ ▾), and its own menu at the top (The Lab ▾) lists
CheeseAI+ first, which brings you back to the board you left. On a phone it is
🧪 The Lab in the bar at the bottom (and in the app menu too): it opens
inside the app, and to go back you tap the board you came from, on the bar or in
More (or use Back, where your phone has one): it is right where you left it.
Settings › Boards › On the phone's bar hides it there, and its place in the bar
goes to your next board. The Lab lays the whole
engine out on one live screen. It adds no data of its own: the same scans,
prices, alerts and 🎯 Picks the boards use, arranged so the whole universe reads
at a glance. Explain mode (press E on a computer, or ⋯ › Explain mode)
puts a numbered label on each part on screen saying what it shows, while the
Lab keeps working underneath; E or Done puts it away.
The Orbit. Every name CheeseAI+ scans is a dot, and its slice is its
sector. Its distance from the gold dashed ring is how far its price sits from
its MELT, measured in that name's own typical day's move: outside the ring
above the MELT, inside it below, with grey rings one and two typical days either
side. Colour is the regime the last scan measured — green long gamma, violet
short, white balanced — and a hollow dot means the MELT and the regime
disagreed at that scan. Size and glow are the size of its net gamma. Levels
change once per scan and only the price moves in between; a dot's ring flares
when the live price clears one of its levels (MELT gold, CHEDDAR green, BLUE
violet) by the same margin the alerts use. A faded dot is on carried levels,
the backup feed or a quote that has not refreshed. Tap a dot for the name's
card — live price, regime, net gamma in your unit, the three levels in % and in
typical days — with a way into its board or Heat. Filter narrows the
Orbit to slices, a regime, names near a level or your watchlist, and Show as
a table lists every name. On a computer the Orbit's key (long γ, short γ,
balanced, the MELT and the rings) opens from ⓘ by its heading (ⓘ Key
on a wide screen; in a narrower or shorter window, ⋯ › Key to the Orbit); a
phone keeps its ⓘ.
THE CHEESE BOARD · Handbook
3 · The boards, one by one (continued)
The Picks desk follows each setup the scan logged today: whether it
was posted, and what 🎯 Picks did with it — taken, or passed over with the
reason in the board's own numbers (a score under the bar, no contract inside
the budget, a print due). The Press lists, newest first, the alerts the
engine logged (the full log is CheeseAI+'s More › Your day › Alerts), changes in
the market's gamma, each closed 15-minute window of
SPY and QQQ Strike Flow (premium traded, an estimate, not direction) and new
unusual prints. The levels line at the foot says when the levels were last
updated (Levels 9:28 PM ET, with "updating…" and its bar while an update
runs); tap it for Levels and updates: the name being updated and how far
along, the hours and the weekend with no updates, the last full update and how
fresh the prices are. The gauges carry VIX and its curve, breadth, the long/short gamma split
and how many names sit near their MELT through the session. Click or tap a
gauge for The day: those lines on one clock with the alerts by kind, the
market's net gamma against every name's gamma added up without its sign, each
sector's split right now, and any gap in the record named. Its ‹ › and menu
reach any of the last sixty sessions: scheduled releases (CPI, the Fed and
others) are dashed on the lanes and named, the VIX shows a year of closes with
that session ringed, and an older session says which lanes it has no record
for (regime changes are kept for the current session only, alerts for about
22 sessions, the status page's gaps for two weeks) and which kinds of release
are not on file for it. Levels
today, at the top of the Press, lists every name where price reached or
broke a level today, in the card's words, with when price first reached each
one (first reached 9:52 AM ET); on a computer each row carries its day
as a strip from 9:30 AM ET to the close, a lane each for CHEDDAR, the MELT and
BLUE: a tick where price last reached the level, ✕ where it broke or crossed
it, a bar while it has held. Show the sieve on the
Picks desk counts how today's setups were weighed, rule by rule, beside the
five sessions before; under the desk's record of closed ideas, random
entries on the same days and rules, scaled to the same number of ideas, are
counted the same way, as in 🎯 Picks: counts and average R, never a rate.
Times are ET.
Jack's read. At the top of the Press (the Press tab on a phone): every
15 minutes in the session, a few plain lines on what changed in the market's
positioning since the last read — market gamma, the names that crossed their
MELT or broke or reached a CHEDDAR or BLUE, the ones that changed gamma or moved
furthest against their MELT, and any sector that shifted. Every name and number
is checked against the scan. Tap a name to open its card; All reads lists the
session's reads; Ask Jack opens Ask Jack in CheeseAI+ on the name you
have open. After the bell there is a closing read, and off hours you see the
last one and when the next comes. When the card says Market read, it was
written from the numbers alone. Positioning, not a forecast.
THE CHEESE BOARD · Handbook
3 · The boards, one by one (continued)
The Lab's Orbit. Every name CheeseAI+ scans, in its sector's slice: outside the gold ring when price is above its MELT, inside when below, the grey rings either side (one and two typical days; 1% and 2% on this board, which had no typical days in hand); green long gamma, violet short, white balanced, bigger for more net gamma. CheeseAI+ · real session, Fri, Oct 23, 2026, after the close.
THE CHEESE BOARD · Handbook
3 · The boards, one by one (continued)
Going deeper in The Lab.Open the book on a card (or double-click a dot)
shows one name's options book: Rings lays its strikes round its MELT,
inside below it and outside above, one segment for each of its nearest
expiries and, where those stop short of them, the next one or two monthly ones
(each monthly marked M, or Q for a quarterly), coloured by the strike's gamma (or vanna, charm, DEX, open interest
or volume), with CHEDDAR, BLUE, the kings and max pain drawn as rings and
today's 15-minute price path at the top. Tap a ring for that strike expiry by
expiry, a cell for its call and its put — their gamma, open interest and
today's trades where the scan kept them. Ladder lays the strikes on a
price scale (every expiry, the front one, this week's or the monthly ones), and beside them the
book's net gamma as price moves up to 6% either way, with today's open
interest held fixed: an estimate, not a path, and nothing about where price
goes. The gold MELT is the scan's own; when it sits further than 6% from the
price, the column says how far. On both, Which book shows it Now,
or cell by cell how it has re-priced Since the open (today only) or
Since the last scan (the same day only, never across the overnight
settle), in net γ, vanna, charm or DEX: open interest settles overnight, so
that is re-pricing, never new positions. On Rings, Through the session
steps through the session's scans, each with its own book, price and levels.
Track has three views. 15 min · 3 sessions shows the last three
sessions in 15-minute steps, with seven layers: the kings, the book's net
gamma, the regime, max pain, how sharply gamma gathers at each wall, vanna near
the price (the 24 kept strikes nearest it) and the front expiry's gamma (gross).
Vanna reads every row on file; max pain, the sharpness and the front expiry's
gamma read only the rows written since they were added; a layer with none on
file says so. Its menu opens one earlier session on its own, with how many scans
each level held where it ended and the week's lines as they stood (the week
before's and the month before's high and low, that week's open and, after its
first session, that session's range): prices already traded, a reference, not a
wall. Daily · 60
sessions shows each close and day's range against that day's levels and the
book's net gamma at the close, E on a session that took in a report; its
volume and IV30 chips add each session's volume and its 30-day
implied volatility at the close (a price, not a forecast). Minutes
today shows today's price minute by minute against each level's band
(within 0.05% of the level or a tenth of a typical day, whichever is larger):
a ring where price reached the band, a filled dot where a minute closed through
it, and how close it came to each. That is what happened, not a
forecast.
THE CHEESE BOARD · Handbook
3 · The boards, one by one (continued)
Card draws gamma and vanna by expiry, IV by days to expiry
beside the VIX's curve, the straddle's priced move against the levels, the
52-week range, calls and puts, and how sharply gamma gathers at each wall, and
lists the name's average volume over 20 sessions, any idea open on Picks ›
Tracked, its filings to sell stock and the names that tend to move together
with it on a report (not a measured link), each with its regime and how far it
sits from its own MELT in its own typical days;
Flow shows the same book another way. A sector's name opens its fan:
each of its names on its own scale, with a band along each spoke for its net
gamma as price moves 6% either way, today's open interest held fixed and each
name against its own largest: an estimate, not a path, and the gold tick stays
the board's MELT. Under the fan, BY EXPIRY adds up the slice's net
gamma, vanna and charm expiry by expiry.
⋯ › By expiry does the same for every scanned name, or any slice from
its menu: each name's first 14 expiries inside the board's 45 days, every strike
of each, summed by date from open interest, with how many names each expiry
holds and the expiry holding the most named. A name with more than 14 expiries
inside 45 days (a fund with daily expiries) stops at its 14th: an expiry past one
of those is marked * and its sum leaves that name's book out. Charm is an
estimate: the delta dealer hedges drift by in a day of time, today's expiry
counted by its close. It says where the book sits, not what an expiry brings.
⋯ › Rates and credit sets the backdrop the positioning sits in on one
sheet: the Fed's target range and the ECB's deposit rate (each dated the day a
change takes effect, with its last move in the year), the 2-year and 10-year
Treasury yields, the 2s10s curve, the high-yield spread, initial jobless claims
and Michigan sentiment, each with its last year as a line, its low and high and
its change from the reading before. Each row is an official value for its date,
often a day behind (daily for the rates, yields, curve and spread, weekly for
claims, monthly for Michigan): context, not a signal. On the day a rate changes,
the row names the move as soon as the series shows it, its year following once
it is read again.
THE CHEESE BOARD · Handbook
3 · The boards, one by one (continued)
Replay steps the Orbit through a session's 15-minute frames, with a
timeline of the frames, the scans, the market's gamma and the alerts by kind.
Its session menu (on a computer beside the last five sessions' buttons) reaches
every session the record keeps, about three months; a session further back is read
from its 15-minute record, so each name's distance there is in its typical day
as it stands now. ♛ Kings marks each name's call king (▲) and put king
(▼) at their distance from its MELT in the frame, and the line under the
timeline counts how many call kings sat above the price and how many put kings
below it, and how many moved since the frame before; the same counts frame by
frame are in a table under the timeline. Where the record holds no kings for a
session, it says so. (On an upright phone the Timeline has no room for the
switch; ♛ Kings is in Curds there.)
Deep (⋯ › Deep view, or D on a computer) stacks a session's 15-minute
frames in time on a tilted Orbit, the newest at the front and the oldest
faintest at the back: each dot is a name at one frame, that frame's price
against that frame's MELT in its typical days, coloured by that frame's regime,
and a line joins its frames, broken where a frame or its MELT is missing; a
dashed grey ring is fifteen minutes with no scan, and the gold dashed rings are
the MELT. Flat, Tilt and Side set the angle; on a computer a drag tilts and
turns it, N faces north, and Week sets five sessions end to end, a layer
an hour. Tilted, distances are foreshortened: read a dot's on its card, or
choose Flat. Pick a name to follow its path in cyan, its book one tap away. Any
of the last sixty sessions can be stacked.
Curds shows every name at once three ways: Today against its
MELT on the session's clock (a dot where price last reached a level, ✕ where it
broke one, each following the price between updates, and cyan dashes either
side of the scan's price at the move its options price through its nearest
expiry, or the one holding its next report where one is listed: what the market
is pricing, not a forecast; a name whose expiry falls on the session's own day
has none until it has passed), Curves (each name's gamma across prices,
the same estimate as the Ladder's) and Sessions (each name's last 60
closes against that day's MELT, coloured by the regime at the close, with each
session's VIX close as a line). Where a name has no typical day, its distance is
in %. Today has a session menu too: an earlier session draws its own frames, its
levels as they stood at its last frame and each name's day % against the close
the session before; the live marks (ticks seen here, level state, the priced
move) are today's alone. ♛ Kings draws the call and put kings through the day as
lines (green the call king, light blue the put king) at their distance from each
frame's MELT. Esc goes back up one step.
THE CHEESE BOARD · Handbook
3 · The boards, one by one (continued)
Terrain, the last of the book's tabs, draws the name's Gamma
Terrain: the book's net gamma re-read at each price, up the side (6% either
way of the price held fixed), at each session close from now to the monthly
expiry, across, with open interest and implied vol held fixed and nothing but time
passing. Green is long gamma, violet short, and brighter is more, against the
name's own largest across these closes, never another name's. Columns are session
closes, not to scale: a weekend is one step. Gold marks the MELT where the board's
own rule places it, at the price held fixed, now and at the Level Clock's times,
and CHEDDAR, BLUE, the kings and max pain are marked at those times too; between
them the picture shows the gamma only. Dots under a column mark one of the name's
expiries leaving at that close. The dashed line is the price held fixed; today's
price is the tick in the left margin, outside the picture. A change from column
to column is contracts leaving or joining and time passing, nothing else. Drag
across it (or use ← and →) and the side panel reads that close, and Show as a
table lists every column. In Curds › Curves, a Level Clock list
shows every name's curve and levels at any of the Level Clock's times, in today's
order. Track shows what was; the Terrain reads today's open interest again at
each later close, price held fixed. An estimate, not a path.
The Sphere.Sphere, beside the Orbit's name, shows the same board
as a globe in space you can turn: each name sits in its sector's slice, and how
far out it sits is its distance from its MELT in typical days (the gold shell is
the MELT, grey shells one and two typical days either side). Up and down only
keep a slice's names apart; they mean nothing. Drag to turn it, scroll or pinch
to zoom, and closer in the names appear; a sector's name flies into that slice,
and sector names show where they fit (turn the globe for the rest). The bar
under it steps through the shells with ‹ ›: only the names at that distance
stay lit, the bar says how many and how far, and the shell you are on is
named; All shows every shell again.
Click a dot and the name opens like an object you can turn: its levels are rings
at their own prices (the gold MELT, CHEDDAR, BLUE and the kings), the white ring
is the live price and the fin along the middle is each strike's net gamma.
Beside it (under it on a phone) each level says how far price is and what today
did there, times in ET. Click a ring to bring that level forward: the gamma at
its strike, the strikes either side and why it moved. Open the book is one
click away, and Esc (or Back on an Android phone) steps back: a ring, a name, a
slice. On a computer the Sphere's key is ⋯ › Key to the sphere, and Orbit or
Sphere is remembered on this device. It is the same scan's
positioning drawn in 3D, not a forecast; under Motion: Off (Reduce Motion's default)
it cuts instead of flying, it turns on its own only under Motion: Full, and where a
browser has 3D graphics off it draws in 2D.
THE CHEESE BOARD · Handbook
3 · The boards, one by one (continued)
On the Sphere, Levels today (under the globe, or L on a computer) draws
each name's levels as shells round its dot, each in its level's colour: dashed
where price reached the level today, solid where it broke it (crossed it, for the
MELT), and a bold ring in the text's colour while price is at one now; a level
price has not visited draws nothing, and nothing is ranked by it. A callout comes
up beside a name for a few seconds as it crosses its MELT or as price comes to one
of its levels, in the same words as the card's. On a phone held upright,
Log lists today's level events newest first in the lower half (a row opens
its name; sideways, the kiosk shows the log), and ⋯ › Turn by tilting turns
the globe as you tilt the phone (your phone may ask to allow motion first;
nothing is kept). ⋯ › Kiosk (K) fills the screen with the globe, its
shells, callouts and log (and Follow on a computer, below), keeping the screen
awake while it runs; Esc or Leave kiosk puts it all back.
The Map.Map, beside the Sphere, puts every name at its
headquarters: the city it is run from, as commonly listed (a company registered
abroad sits where it is run). U.S. shows the states, World every
country; Bay Area and New York are fixed views, with no zoom, where
each city is its own place, shaded under its names. Funds have no single home and
are left off. Each place with names on
the list is shaded by its own names, as the buttons over it choose: Day move
colours it green or red by the median of its names' moves today, each in its own
typical days, darker for a bigger move; Gamma by how many more of its names
are long γ than short (the board's green and violet); From the MELT by the
median distance of its names from their MELT, in typical days (% where a name has
none), the Orbit's measure: cyan above, orange below (red on Ember and Solar,
whose gold is amber, so the shade never reads as the MELT's gold); Turning
by how many turned long or short since the close five sessions back. A dot is one name;
names close together sit in a small spiral round their place, and a ring counts
a crowd too big to draw at that zoom, its edge split by how its names did (tap it
to zoom in). Drag to move, scroll or pinch to zoom; tap a dot for the name's card,
a place for its names, and Places for every place in order of its shade.
The notes along the bottom say what stands out: the places most up and most
down, the biggest moves, the places with the most names. Started with the Map
open, Replay plays on the Map: each place as that frame's scan read it
(Turning and the webs read the board now, so they stand aside). It groups the
same scan's board by home, on the same clock as everything else, and says what
happened, never what comes next; where a company is based is not a forecast of
anything.
THE CHEESE BOARD · Handbook
3 · The boards, one by one (continued)
Webs.Webs, among the Map's buttons, joins companies around their
reports. From each name that reacted to a report today, or reports today after the
close or over the next sessions, a line runs to the names in its theme group: the
board's own groups of names that tend to move together on a report (chip makers
with chip makers, and so on), the same ones the Earnings board lists beside a
report. A name that reports gets a ring, and a company with a filing on record
(the 📄 of the Offering watch) a dashed ring. Tap a name and its own web is drawn
strongest; its card says when it reports and which names tend to move with it.
The Map joins only what the board holds: a filing involves one company, so it is a
ring rather than a line, and the board carries no deals between companies, so none
is drawn. Zoom goes much closer than before (28× on the U.S., 48× on the world),
and up close each city is named above its names. A theme group is a grouping, not
a measured link, and a line is no forecast of how this report goes.
The same board as the Sphere: each name in its sector's slice on a globe you can turn, how far out it sits its distance from its MELT (in typical days; in % on this board), the gold shell the MELT. MSFT opened on it: its levels as rings at their own prices (CHEDDAR, the kings, BLUE and the gold MELT), the white ring the price and the fin each strike's net gamma; beside them, how far each level sits from price, and the name's card under it. CheeseAI+ · real session, Fri, Oct 23, 2026, after the close.
THE CHEESE BOARD · Handbook
3 · The boards, one by one (continued)
The Lab says plainly when the market is closed or outside regular hours, when the
live price has paused, when levels are older than they should be, and when the
connection drops. On a phone it opens between CheeseAI+'s two bars, with
its own tabs along the bottom, just above the app's bar, for the Orbit, the Press (it opens on Jack's read), the Picks and the Names (every name
as a grid you can search and sort). Over the Orbit one row of buttons switches
the view (Orbit, Sphere, Map, Curds and Replay), and ⓘ beside them opens the key.
The gauge cards show two at a time with a bar under them: swipe for the other
two, and tap one for The day in a sheet. Replay's timeline sits under the Orbit,
the centre showing that frame's short share; Curds takes the Orbit's place
until you choose another view. A tap where dots crowd lists the names under
your finger, and every card and the scan's pass opens in a sheet you drag up
for more or down to close. Sideways, the Orbit sits beside the tab you are on,
and Curds gives way to the Orbit. It also runs full screen on a second
monitor, and in a Stream mode for sharing a screen. Motion
is Full, Calm or Off, and Off under Reduce Motion; it rests while its tab is
hidden. On CheeseAI, The Lab is in the CheeseAI ▾ menu under With CheeseAI+, and on a phone in the bar, each with a 🔒, and shows what CheeseAI+ adds.
Follow (⋯ › Follow, or R; a computer's) steps through the session's own
events: a level reached, broken or crossed in the last two minutes, else the
Picks desk's newest card of the last fifteen minutes, else the index majors in
scan order. Each step prints why (with its time in ET), opens that name's card
for a few seconds and stays 10, 20 or 40 seconds; at most three wait, and any
input holds Follow for a minute. In a browser window 2400 × 1300 or larger
(Wall+; a 2560 × 1440 screen in full screen) the followed name gets a
column of its own between the Orbit and the Press: its price, its levels drawn
to scale with what today did at each, and the steps so far. Follow reads the
board alone and keeps nothing; it keeps the screen awake only full screen on a
wall or in Stream.
Common mistake: reading a dot's distance as a forecast.
It is where price sits against the last scan's positioning right now, in that
name's typical days — a description, not a prediction. The same goes for the
curves (today's book re-priced across prices, not a path) and the 60 sessions
(closes that already happened).
THE CHEESE BOARD · Handbook
3 · The boards, one by one (continued)
The Lab on a phone. Left, the Orbit tab: two gauge cards a screen, one row of view buttons (Orbit, Sphere, Curds, Replay, and ⓘ for the key) and the Orbit. Right, the Names tab: every name as a grid you can search and sort, with the four tabs along the bottom. CheeseAI+ · real session, Fri, Oct 23, 2026, after the close.
THE CHEESE BOARD · Handbook
3 · The boards, one by one (continued)
💧 Flow (CheeseAI+)
A CheeseAI+ page, live in the session. Flow reads the options money
traded through the session beside the price. It shows premium spent and, where
the trades were read against the quote standing at the time, which side it
traded on. It does not show who traded, why, or whether a trade opened or
closed a position. On a computer it opens from the app menu at the brand
(CheeseAI+ ▾), as it does from every app's own menu; on a phone it is
💧 Flow in the bar at the bottom, beside 🔥 Heat and 🧪 The Lab, and it
opens inside the app; there More › This screen carries its Find a name and
How to read, and on an Android phone Back closes Flow's open
sheet before it closes Flow. Settings › Boards › On the phone's bar hides it
there, as The Lab, and its place in the bar goes to your next board. Pick a name: SPY and QQQ come
first, then the names with the most premium today, and ★ Your names
keeps to your watchlist. Beside them, Standouts lists the board's
unusual contracts, 10 at a time, and Open in Flow → on 💥 Unusual opens
a name here.
The price moves every 5 seconds. Premium is added up at each update, about
every 5 minutes, and SPY and QQQ are also read every 10 minutes from the trades
themselves. Before the open every view shows the last session's record, and
after the bell the session as it ended: the day's premium, every stretch, every
lean and how each was graded. Times are ET. It has five views, Pull,
Money, Tape, Lean and Days, and How to read
goes through each of them on the page. On CheeseAI, Flow is in the CheeseAI ▾
menu, under With CheeseAI+, with a 🔒, and shows what CheeseAI+ adds.
THE CHEESE BOARD · Handbook
3 · The boards, one by one (continued)
Pull is the gamma pull: where the 0DTE card's model puts today's
close, the strikes doing the pulling, and the ♛ kings — the biggest call and
put strikes with every expiry added up. A heuristic, not a forecast: solid on
calm long-gamma days, unreliable in short gamma or on news. It is the 0DTE
card's own model, the one Heat draws, not a second one: the projected close and
its likely range as of the last update, the strikes pulled toward, max pain and
charm. The ♛ king call is marked when it sits past today's likely range, where
the model gives it little pull; the ♛ king put is the heaviest short-gamma
strike, which the model gives no pull. Each level carries the priced odds of a
touch before the next expiry's close, read from the name's own option prices
(touch, not close: tagged and given back still counts), and the options' priced
range, one standard deviation either side, to today's close, this week's and
the month's. It is what the market is pricing, not a forecast. Under them, the
premium traded at those strikes today and in the past 30 minutes. Beside the
pull, never inside it: the scored projection reads open interest only. Whether
premium at a king adds anything has not been tested. Show the OI + flow
estimate adds Heat's estimate that also reads today's trades: a model
projection, not a target; an estimate, not scored. This week's line is the same
model's projection to Friday's close, scored in public.
THE CHEESE BOARD · Handbook
3 · The boards, one by one (continued)
Money is call and put premium added up through today, beside the
price: calls and puts on the front expiry, the 24 strikes either side of the
price, paid for time value and added up since the bell, over 5-minute candles
and the day's VWAP. Premium spent, not which way it traded — except the two read
lines. A rising put line can be protection being bought. The two read lines, on
SPY and QQQ, are bought calls + sold puts and bought puts + sold calls, from the
trades read every 10 minutes, and the page says what share of the premium was
read to a side. With Projection on, Pull's path to the close is drawn on
the price.
Tape is the biggest contracts. On SPY and QQQ it shows each 10-minute
stretch of the session: premium paid for time value on the front expiry, split
into bought, sold and not read to a side, and the contracts that carried most of
it, with how much of each was swept (bought or sold across two or more exchanges
within 2 ms — one order split up) and the stretch's pace against the day's.
Each contract's premium tip also gives the full price paid, as Standouts does. On
every other name it shows the premium between one update and the next, with no
side. Filters keep to bought or swept contracts, and to single legs where the
trades carry the markings. Set aside: contracts under 10¢, strikes more than two
priced moves away, and trades the tape marks as legs of a spread or tied to
stock. A hedge looks like any other trade, so hedges stay in. Where the trades
carry no spread markings, the page says so and every trade stays in.
Days is sixty sessions of call and put premium, day by day: the whole
book's premium paid for time value, calls above the line, puts below, beside
each close; on SPY and QQQ, also what was bought and swept, from Mon, Nov 2,
2026 on.
Lean is the flow lean on SPY and QQQ. A rule read from the numbers
every 10 minutes from 9:50 AM to 3:30 PM ET: which way the read money has
leaned — bought calls and sold puts against bought puts and sold calls. It
holds until the read turns. It describes the money, not what price will do. It
reads BULLISH LEAN, BEARISH LEAN or NO LEAN, with the time
it began, on a ring of the session's 10-minute steps, and five bars show its
readers: today so far, the past 30 minutes, the past 10 minutes, holding, and
price with it. Every lean today is marked on the price with its points 30
minutes later, and the lean log lists each one and how it was graded, beside a
random lean at the same time (§5 says how). Counts and points, never a rate. On
a half day the last new lean is at 12:30 PM ET, and other names have no lean.
Common mistake: reading a bought call as a bet that
price rises, or a lean as a forecast. Flow cannot tell a hedge from a bet. A
trade read as bought may be protection, one leg of a spread the tape does not
mark, or a position being closed. The pull is a heuristic, not a forecast, and
the lean describes the money, never what comes next.
THE CHEESE BOARD · Handbook
3 · The boards, one by one (continued)
🖨️ Print Shop (CheeseAI+)
The earnings season in one place, at /prints. It opens from the app menu at
the brand (CheeseAI+ ▾) on a computer and a phone: on a computer as its own
page, whose menu at the top (Print Shop ▾) lists CheeseAI+ first, the way
back; on a phone inside the app between the bars, as Heat, The Lab and Flow do, with
Back taking you to the board you left. It reads the same board as the app and asks again once a minute while it is
on screen. Five views:
Up next: the next prints still to come (today before the open until those
prints are out, today after the close, then the next session before the open and
after the close; a print with no time of day under its own day), each with what the options price
for it (its implied move), the move in the session just before it (the report day
itself for a print after the close, the session before it for one before the open,
live while that session is today's and still trading) and that move set against the
implied move (0.5× is half of it already made), its typical day, the middle move of
its past prints, how many of those prints moved more than what was priced for them
("5 of 8 more than priced": its history, not a forecast) and its positioning. This week: every name with a
report in the next ten sessions, under its day and time of day. Reactions:
the names reacting to a report today, each day's move against the implied move
priced for it, as a bar over the priced band, and counted: how many moved more than
their implied move so far and how many less. Season: the graded prints of
the last 60 days, how many moved more than their implied move and how many less, the
middle print's move against its implied move, the names that moved most and
least against it, and the same counts by sector (from three graded prints a
sector; tap one to narrow to it). How to read says the same in short.
Over the lists, a sector menu and ★ Your names (your watchlist)
narrow every view to one sector or to your own names. Nothing is saved: the page
opens on every name each time.
Tap a name for its card: when it reports, what is priced, the move before the
print, its typical day, its positioning and distance from its MELT, its record of
prints (each move drawn over the implied move that was priced for it), what followed
each print (three and five sessions after, and the 30-day implied vol either side),
how its group moved on each, and the way to its board in CheeseAI+. On CheeseAI its row
in the CheeseAI ▾ menu, under With CheeseAI+, carries a 🔒 and opens the Upgrade sheet.
On a reporting name's card, and in a fold under its row in Up next, its group
this week: one line for each name that tends to move with it, what that name's
options price for a move through this week's last close beside its typical move on
the sessions that reacted to this name's past reports ("typical —" with fewer than
two on file). A price, not a forecast, and not a measured link.
Common mistake: reading the implied move as where a name is
headed. It is the options' price for the report, not a forecast, and a name that has
moved ahead of its print can still move either way after it.
THE CHEESE BOARD · Handbook
3 · The boards, one by one (continued)
💼 Portfolio Manager (CheeseAI+)
A model portfolio for study, not advice: a hypothetical $10,000, never real
money. It is at /port, and it opens from the app menu at the brand
(CheeseAI+ ▾) on a computer and a phone, and from every app's own menu: on a
computer as its own page, whose menu at the top lists CheeseAI+ first, the way back;
on a phone inside the app between the bars, with Back taking you to the board you
left. On CheeseAI its row in the CheeseAI ▾ menu, under With CheeseAI+, carries a 🔒
and opens the Upgrade sheet.
Every session after the close (from 4:30 PM ET; 1:30 PM ET on a half day) the
rules build a shortlist of companies well below their own averages — under their
200-session average, at least 15% and two typical 20-session ranges under their
252-session high, and a 14-session RSI of 35 or under — whose latest filings with the
SEC pass at least 6 of 8 fundamentals checks, net income and free cash flow above
zero among them: twelve at most, no more than 2 from one sector. Cheese AI picks at
most 3 from it, with a line or two each, using only the facts on the shortlist; when
it cannot, the rules pick the top of the list, and the page says so and why.
Each pick enters the model portfolio at the next session's open: 10 equal slots of
$1,000, at most 2 a sector, whole shares. It is held through its reports, with the
date shown, and leaves at the next session's open after its close is back above its
200-session average, after 60 sessions, or when a newer filing no longer shows net
income or free cash flow above zero. Every closed position is set against SPY over
the same days and against a random pick from the same shortlist, set by the date so
it cannot be chosen after the fact; Cheese AI's picks and the rules' are counted
apart, and nothing is called a record until 10 positions have closed. Filings lag the
quarter by weeks, so every check says the date of the filing it read, and a company
that reports from abroad files no quarterly reports in that form and is not graded.
Prices only: no dividends, fees or slippage. Until the companies' filings have been
read, the page says so, and the first shortlist comes after a session's close once
they are in.
If SPY's closing price for a session has not come in by 10:00 PM ET, the
session's pick is still made, without it, and Today says so, with how many
companies' closes were missing too (those companies are not measured that
session): the portfolio sets each position against SPY's opens, so nothing is
guessed; when SPY's prices for that session are missing altogether, its entries
and exits are booked after the next session's close. If too few of the session's
closes have come in by then to measure a shortlist, nothing new is chosen, Today
says why, and the Shortlist stays the last one measured, under its own date;
nothing is guessed or filled in later.
THE CHEESE BOARD · Handbook
3 · The boards, one by one (continued)
Five views. Holdings shows the model portfolio's value against the
hypothetical $10,000, its cash, and each position: when it entered, the sessions
held, its move since entry, that move against SPY's in points, why it was picked and
its next report. Under each position a line draws its closes since it entered
against its entry price, SPY's closes over the same days against SPY's own price
at the entry (dashed), and the position's 200-session average (dotted), so you
can see how far its close sits from that average (a close back above it ends the
position).
The line is written once a session after the close from the settled closes; it
ends at the last close both it and SPY have on record. Today shows the
session's picks with their lines, or that the rules chose and why, any pick the
portfolio had no room for, and the market around them (VIX, the index books, who
reports next and what is next on the calendar). Earlier session and
Later session step back through the sessions before: who chose and why,
each pick with its lines and the random pick it is set against, when it was
picked (or, for a session that chose nothing, when it was recorded), and that
session's shortlist by name (only the latest session keeps each
name's card). Shortlist lists each company
with the checks it passed, how far it sits under its high, its RSI, its report date,
its gamma and the side of its MELT it is on. Record counts the closed
positions that moved more than SPY over the same days and those that moved more than
the random pick, Cheese AI's and the rules' apart: counts, never a rate, and Not a
record yet until 10 have closed. How to read says the same in short. Times
are ET, and the page asks again every five minutes while it is on screen.
THE CHEESE BOARD · Handbook
3 · The boards, one by one (continued)
Tap a name for its card: its eight checks, each marked passes, does not pass, not on
file or skipped, with the figures it compared and the date of the filing it read.
They are: net income over the last four quarters above zero; operating cash above net
income; free cash flow above zero; revenue up on the year; operating margin at or
above a year earlier; net cash, or debt to equity down on the year, with current
assets at least current liabilities; diluted shares up 3% or less on the year and no
stock offering filed in the last 30 days; and price to earnings under its own median
at the last 8 quarter-ends (price to sales when earnings are zero or less). A bank or
financial company skips the balance check and still needs 6 of the other 7. Under
the checks the card lists the company's last eight quarter-ends, newest first:
revenue and earnings per share over the four quarters to each quarter's end, the
quarter's own earnings per share and its diluted shares, each row with the date of
the filing it was read from (a figure restated in a later filing shows that later
date). A figure the filings do not carry reads not on file; it is never filled
from the quarter beside it. The card ends with the way to its board in
CheeseAI+.
Common mistake: reading the shortlist or a pick as a reason
to trade. It is a model portfolio for study, chosen by written rules and Cheese AI from
what the prices and the filings say; a company well below its averages can stay there
or fall further, and a handful of closed positions says little either way.
THE CHEESE BOARD · Handbook
3 · The boards, one by one (continued)
🧭 Compass (CheeseAI+)
Where the market stands against its own past. It is at /compass, and
it opens from the app menu at the brand (CheeseAI+ ▾) and from every app's own
menu: on a computer as its own page, on a phone inside the app between the bars. On
CheeseAI its row under With CheeseAI+ carries a 🔒 and opens the Upgrade sheet.
History, not a forecast. Education, not advice.
Five views. The picture: sixteen figures across stocks, volatility, rates,
the dollar, gold, bitcoin, credit and leadership, each beside its change over 3
months and dated by its own close; an ⓘ on each says what it is. The S&P 500 and the
Nasdaq-100 are read through SPY and QQQ, semis through SMH. Rates and credit ends
with a link to the Lab's Rates and credit, which reads the same 10-year and links
back. Closest past periods: each figure is measured in its own typical spread
(a median-based measure), the differences from today are weighted and combined into
one distance, and the past days are ranked by it. One day stands for each period,
and the last year and the current fall from its high are left out, so no period
counts twice. Three ways to read it — the whole picture, prices and volatility, and
rates and the dollar — each with what the S&P 500 did 1, 3, 6 and 12 months after
each day and its lowest close in the 3 months after, beside the base rate: how often
it was higher a year later on any day. A tap on a day shows the figures that sat
nearest today's.
Paths: three past periods' own day-by-day moves laid onto SPY's or QQQ's
close, the closest one and the highest- and lowest-ending of the others, read in %
and sessions, never a price level. Scenarios from history, not a forecast.
What followed past lows: six readings that showed up in the weeks after past
lows, each met or not met against today's closes by a fixed rule, and how often each
showed up after past lows and on other days: a description of the past, not a
signal. How to read says all of this in the page's own words. Compass keeps
nothing about you: it is one answer for everyone.
THE CHEESE BOARD · Handbook
4 · How to actually use it
New to the boards?Help › Start here holds five two-minute
lessons on the walls, the MELT, the Heatmap, the 0DTE board and alerts. Your
names come first (up to three you follow), and every lesson ends on those names,
live, with a button to the board it just covered and a line saying where to find
that tool again. If you say yes, the names also go on the ticker tape, the first
goes on screen and, on CheeseAI+, they join your watchlist: each line yours to
untick, and Not now changes nothing. For a new account's first two weeks the
Start here line at the top offers them with the tour, alerts and Easy or
everything; each step gets a tick when you finish it, saved to your account. They
teach how to read what is on the screen, not what to trade.
Start with the regime. Long gamma or short? Long gamma has tended to
damp moves between the walls; short gamma has tended to add to them.
Everything else is detail.
Find the walls. Cheddar and Blue bracket your working range — Cheddar
the call wall above, Blue the put wall below. Price working toward one is moving
toward the heaviest gamma on that side of the board.
Check the distance to MELT. Close to the flip means the character of
the session can change in one move.
Sanity-check against the pin band. If your idea needs more room than
the gap between the walls, it needs one of them to give way — fine, but know
that you are betting on a wall breaking, not just on a big day.
Look at the front expiry. Whichever column owns the gamma sets
today's levels.
On a wide desktop screen the margins either side of the board carry small
side boxes — a glance layer over the boards, not a board of their own.
The right side is the tape: the majors, what's hot, the heaviest gamma, names on
the knife, today's dips and, on CheeseAI+, your 📡 radar's five nearest names.
The left side is the calendar: what's on deck, a little
grid of the month, who reports next, the next expiry, what has fired. Every row
is a tap into the board it came from. They carry dates and positioning, never
a forecast; fold any box from its heading, or switch them between Compact, the
default, Full and Off in Settings › Display › Side boxes. Phones, tablets and the
app view don't show them.
On a phone, one frame. The bar at the top and the bar at the bottom
never move: Home, the boards and apps you pin and More sit in the bottom bar — the
one row at the bottom — and whatever you open lands between the two. Switch from a board to Heat and back and the page doesn't jump, and the board
is where you left it. The boards the bar does not carry are in More › Go to.
Print Shop, the Portfolio Manager and Compass open from the app menu at the brand
(CheeseAI+ ▾), and §3's Finding your way says where everything else lives.
THE CHEESE BOARD · Handbook
4 · How to actually use it (continued)
Your levels on TradingView and thinkorswim. The Share menu copies a
ready-to-paste TradingView script with the name's CHEDDAR, MELT, BLUE, max pain
and kings in it, marked with when you copied it and the scan it came from, and
good until the session's close; after that its lines dim and a note asks you to
re-copy. On CheeseAI+, TradingView, your watchlist, just under it, copies one
script for every name on your watchlist: add it once, and on each chart it draws
that name's own levels, picked by the chart's ticker, with the same dates and
good-until. A name with no levels on the board yet is left out, and the script's
notes say which. thinkorswim levels works the other way round, because
thinkorswim can't fetch anything from outside: you add the CheeseAI study once
(in thinkorswim desktop: Charts › Studies › Edit studies… › Create…), then enter
the day's seven numbers in its settings, the six levels and a good-through date,
each of which copies with a tap. Past that date its lines turn gray. Copies are
counted, without saying who made them.
What this will not do. It won't tell you direction, it won't front-run
news, and it doesn't know about the earnings call after the bell. Positioning
describes the terrain, not the weather. Every level here is a place where
hedging pressure concentrates — price still has to get there on its own.
💧 Flow cannot tell a hedge from a bet, and its lean describes the money, not
where price goes next.
The Level Clock is not a forecast of the levels or of price: it is today's open interest with time passed, price held fixed.
THE CHEESE BOARD · Handbook
5 · Methodology, and where it's approximate
Being straight about this matters more than sounding authoritative.
Our own greeks. Gamma, vanna, charm and delta are computed here with
Black-Scholes from the raw chain — implied vol, open interest, strike, time
to expiry. No vendor's pre-computed exposure number is used, so the numbers
are reproducible rather than a black box. The model is the textbook
European one, with no dividends and one fixed interest rate (4.5% a year):
close for gamma near the money, a few percent off for an American put deep
in the money, and a little off for a high-dividend name. An implied vol
that cannot be right — far under or over its neighbours, as a stale or
one-sided quote can be — is replaced from those neighbours on the same
expiry before anything reads it; the contract and its open interest stay.
Open-interest based. Exposure is built from standing open interest,
not from a feed of what dealers actually did. That is an assumption,
and it's the same one behind nearly every GEX tool available.
The dealer-sign convention. We assume dealers are net long calls and
net short puts — the usual result of investors selling calls against shares they own and
buying puts for protection. It holds on aggregate index flow and is shakier
on a single small-cap name.
The option chain is real time. The quotes, implied vol and trades
the levels are built from arrive as they happen. Open interest — which is
what the walls are built from — still only settles overnight, so the walls
move with each new session's positioning, not tick by tick. The status
pill is read off the data's own timestamps every session: if the chain
ever runs behind, it says so in words (Delayed 15 min) instead of Open.
THE CHEESE BOARD · Handbook
5 · Methodology, and where it's approximate (continued)
The price is live. The price beside the levels comes from a
live stock feed and refreshes on its own clock rather than waiting for the
next scan — every 5 seconds on both tiers for every name, and trade by trade
on CheeseAI+ for the name you have open. The status pill measures its delay off the quotes' own
timestamps and says so in plain words if the price falls behind or stops
arriving. It is
one exchange's view of the tape, so it can sit a few cents off your
broker's; on a fast day, check your broker's price before acting on a level
the board's price looks close to.
Rescanned all session. A full pass starts every 5 minutes during
market hours on both tiers, and on CheeseAI+ one pass covers every name in
a couple of minutes. The price
keeps moving between passes (above), and the status pill's Data popover says
when the next update is due, from the pace actually measured, not the target. Level alerts are
checked between passes too: every 75 seconds on CheeseAI, every 30 seconds
on CheeseAI+. Between the close and the next premarket the levels are
rescanned once an hour on CheeseAI and every 15 minutes on CheeseAI+, so
they don't sit frozen overnight. A stale-data banner appears if a scan
fails, by one limit in the app and Heat. Times are in ET and say so
(Settings › Display › Time zone can use yours, still labelled); market hours always
are, because 9:30 AM ET is a fact about the exchange rather than about you.
Everything is in US dollars. A strike is a dollar amount on a US
contract — converting it would produce a number that exists in no chain.
Thin chains get dropped. A name without enough open interest to price
is marked "no data yet" rather than shown with a fabricated level.
The record is kept. Every session's levels are kept for years, not
the last few months, with a copy saved away from the app each night, so
the history behind the public record, the graded Picks and the levels'
own track record does not roll off. The replay's past sessions, a frame
every 15 minutes, reach back about three months.
Compass reads closes. On CheeseAI+ Compass is built once after each
session's close (4:30 PM ET; 1:30 PM ET on a half day) and again when a newer
official rate, VIX or dollar value is published. Yields, the curve, VIX, VIX3M
and the dollar are official values for their own date, often a day behind (the
dollar is published weekly), and each figure shows its own date.
Is it working?cheeseai.app/status,
free and public, says when the levels last updated and when the next update
is due (ET), whether live prices are ticking, and whether CheeseAI, CheeseAI+
and Heat are each answering — or "not checked" when one could not be asked,
rather than a guess. When something is known to be wrong a note at the top
says so, and the last seven days of incidents are listed: what members would
have seen, and when it ended. The app's warning bar links to it.
THE CHEESE BOARD · Handbook
5 · Methodology, and where it's approximate (continued)
The Level Clock moves time, nothing else. At each of its times, every one a session's close, it rebuilds the book from the contracts open then: expiring contracts leave, and the rest are re-priced with less time left. It counts the expiries the board itself would count at that time, those listed within 45 days of it, as far as the options we read reach; a time waits, and says until when, while a monthly expiry the board would count then is beyond that. Price stays at the scan's, and open interest and each contract's implied volatility stay where they are now, so positions opened or closed later are not in it. CHEDDAR, the MELT, BLUE, the kings and max pain are then found with the board's own rules, starting from today's walls. It is an estimate, not a path, and not a forecast of the levels: new positions open every day, and the next scan replaces it.
The flow lean, and how it is graded. 💧 Flow's lean on SPY and QQQ is
a written rule, read from the numbers, never a model's opinion. Each
10-minute stretch's trades are read against the quote standing at the time:
bought calls and sold puts count one way, bought puts and sold calls the
other, and the rest is not read to a side. Five readers each point one way
or neither: today so far, the past 30 minutes and the
past 10 minutes (one side's read premium ahead of the other's by at
least 15% of all that was read, and neither while under $250K was read),
holding (at least 4 of the last 6 stretches on today's side) and
price with it (the last 30 minutes' move past the dead zone below).
A lean begins when today so far points its way, at least 3 of the 5 readers
agree and neither today so far nor the past 30 minutes points against it;
it holds until today so far turns or 3 readers point against it. A stretch
less than 20% of which was read to a side, or one that could not be read,
leaves the lean where it was. The first lean can come at 9:50 AM ET and the
last new one 30 minutes before the close (3:30 PM ET; 12:30 PM on a half
day). Each lean is graded once, on the price 30 minutes after it: with it or
against it by at least the dead zone, a quarter of the name's
ordinary 30 minutes (its typical day's move, scaled to 30 minutes of the
session), otherwise too small to count; with no fresh price at either end
it is not graded. At every graded lean a random side at the same time, set
by the date, the name and the time so it cannot be picked after the fact, is
graded on the same two prices. The record is counts (with it, against it,
too small to count) and points, today and since the first lean, beside the
random leans; it never shows a rate, and it says nothing until 10 leans
have been graded. A change to the rule starts a new record.
The honest summary: this is a well-built model of dealer positioning, not a
recording of it. Treat a wall as a zone of likely activity, not a guarantee.
THE CHEESE BOARD · Handbook
6 · The two tiers
CheeseAI
CheeseAI+
Boards
All 9
All 9
Alert record — the last two sessions, the 20 before them and a chip for each kind
Yes — More › Your day
Yes — More › Your day
Tickers
12 core names (index majors + Mag 7 + semis)
250+ names
Included with a paid membership in Paul's Discord
Yes
— (sold separately)
Discord alerts & briefs
With + Cheese Discord
With + Cheese Discord
Help (each board's guide, the Legend, What's new), Easy mode, and a tap on CHEDDAR, BLUE, MELT or MAX PAIN for the word
Yes
Yes
Price refresh between scans
Every 5 seconds
Every 5 seconds
Level alerts checked
Every 75 seconds
Every 30 seconds
Overnight rescans
Once an hour
Every 15 minutes
🎯 Picks — model ideas that clear written rules, graded in public, with a $10,000 model account
Yes
Yes
Picks, Pulse, Dips, Unusual & Vol search
The 12 core names
All 250+ names
📏 Range Finder — each name's range for the session from its close and its vol, with range alerts and the 9:00 AM ET ranges
Yes, on its seven names
Yes, and add up to 20 names of your own
Alert quiet hours
Yes
Yes
Alerts you can check — a test to your phone, your devices, why an alert was held
Yes
Yes
The market line under an alert and Market at entry on every Pick — the name's next report, the calendar, VIX and the index books
Yes
Yes, and a chip name's line counts the semis long and short gamma
THE CHEESE BOARD · Handbook
6 · The two tiers (continued)
CheeseAI
CheeseAI+
The morning brief at 9:00 AM ET, with what changed overnight across every name, and the evening recap, in the app
Yes
Yes
📖 The Picture Book — the day and, on the week's last session, the week, as pictures at 4:30 PM ET, to save or share
Yes
Yes
Heatmap colour-blind colours, reading aids, expiry slices, monthly expiries and change views (Opened overnight among them), thin open interest between the walls and each strike's quote time
Yes
Yes
What today did to each level — touched, broke, held, standing — and why a level moved
Yes
Yes
🕰️ Level Clock — where each name's levels would sit after today's close, this week's expiry and the monthly expiry, if price stood still (an estimate)
Yes
Yes
The Cheese Wheel — a study sheet, one turn at a time, on a name's board: sell a put, own the shares, sell a call
Yes
Yes
If price were at… — a name's book at a price you type or drag, open interest held fixed (an estimate)
Yes
Yes
Options — a contract's own card (its greeks, breakeven, touch odds and where its strike sits), what each expiry prices, with the IV curve beside the VIX's, and max pain for each expiry with open interest by strike
Yes
Yes
THE CHEESE BOARD · Handbook
6 · The two tiers (continued)
CheeseAI
CheeseAI+
Price — the session's VWAP, the week's lines and the dates on the chart
Yes
Yes
Show as a table — Profile's Price and Exposure charts as tables that follow the live price
Yes
Yes
Put/call volume against its own record (on Vol, SPY's; on a name's Options board, that name's)
Yes
Yes
Start here: the tour, your names, alerts, five short lessons on reading the boards, and Easy or everything
Yes
Yes
🏠 Home on a phone — every board, app and tool as a tile, the bar's pins and the board order
Yes, with the CheeseAI+ apps locked in its last section, With CheeseAI+
Yes, and hide a board from it
Check my access — which of your memberships opens which app
Yes
Yes
Replay at 1×, 2× or 4×, past sessions (opened from a print or a past CPI or Fed day too), another session beside one, and practice with its reading questions
Yes
Yes
Earnings — each name's last eight prints, gap and move, what followed each and its group's moves
Yes
Yes
Your levels as a TradingView script or a thinkorswim study
Yes
Yes
Your whole watchlist's levels in one TradingView script
—
Yes
Trade-by-trade price on the name you have open
—
Yes
THE CHEESE BOARD · Handbook
6 · The two tiers (continued)
CheeseAI
CheeseAI+
🔥 CheeseAI Heat — full-screen heatmaps for up to nine names, built for phones (on a phone it opens inside CheeseAI+, from the bar at the bottom): alerts, tap-a-cell, replay, what changed since the open, Breadth, Themes, the Map, Strike Flow, each board but Strike Flow as a table, and the 0DTE board's projected close on its candle charts (a model projection, not a target)
—
Yes
🧪 The Lab — the whole engine on one live screen: the Orbit, the Sphere (the board as a 3D globe) and the Map, the Picks desk, the Press, each name's book with its Gamma Terrain, a session's replay, Curds and Deep (a session's frames stacked in time), gamma, vanna and charm by expiry across the market and each slice, a rates and credit sheet, Follow and the kiosk, a short read of what changed every 15 minutes, and Explain mode, a label on each part saying what it shows
—
Yes
💧 Flow — options premium read through the session for every name, the gamma pull and its ♛ kings, and a 10-minute lean on SPY and QQQ graded in points
—
Yes
🖨️ Print Shop — the earnings season in one place: the next prints with what the options price and the move just before each, the week's calendar, today's reactions against their implied moves and the season's record
—
Yes
THE CHEESE BOARD · Handbook
6 · The two tiers (continued)
CheeseAI
CheeseAI+
💼 Portfolio Manager — a model portfolio for study, not advice: a hypothetical $10,000 in companies well below their own averages whose SEC filings pass its checks, each closed position set against SPY and a random pick
— (🔒 in the app)
Yes
🧭 Compass — where the market stands against its own past: today's picture, the closest past periods and what followed them, paths from history and what followed past lows. History, not a forecast
— (🔒 in the app)
Yes
🧀 Cheese AI read
—
Yes
🧀 Ask Cheese AI your own questions
—
Yes
Your questions read on the expiries you pick (today, this week, this month), with Copy and Flag on every answer
—
Yes
Personal watchlist, with 📡 Radar — your names nearest a level first, live, a push when one comes within your distance and, on a wide screen, its five nearest in a side box — and 💥 flow push when a new Unusual row lands on one
—
Yes
Your names in the morning brief and the evening recap — your watchlist names at a wall, moved overnight or reporting today, and where each closed against the walls set at the open
—
Yes
Custom Charcuterie sets
—
Yes
Private per-ticker notes
—
Yes
THE CHEESE BOARD · Handbook
6 · The two tiers (continued)
CheeseAI
CheeseAI+
🔖 Your levels — your own prices on every board, a push when price crosses one
—
Yes
📄 Offering watch — a chip and an alert when a company files with the SEC to sell stock
—
Yes
Alert settings — which kinds buzz you, muted names
—
Yes
Phone alerts for your watchlist names only
—
Yes
Discord /levels, /board, /watch, /hot, /market, /earnings, /picks, /vol and /book, with level-break DMs and an open/close watchlist digest
Every board is in both tiers. Plus adds coverage, a faster clock, the
features that make the board yours, CheeseAI Heat — the full-screen
heatmaps described with the boards above — The Lab, 💧 Flow, 🖨️ Print Shop, 💼 the Portfolio Manager and 🧭 Compass.
In Paul's Discord? A paid membership — the Full Membership, monthly,
yearly or lifetime, or Premium Lifetime — includes CheeseAI at no extra
cost. Sign in with the Whop account that holds the membership; there is nothing
else to buy, and access lasts as long as the membership does. CheeseAI+
is not included and is sold separately: add it on its own and keep your
membership, which already includes the Academy. (CheeseAI+ & Academy
is for people who are not members yet.)
Not sure what opens what?Check my access (Settings › Account ›
Check my access, or the button on the page that turns a sign-in away) shows which
memberships your Whop account holds, whether each opens CheeseAI, CheeseAI+
or neither, and what to do: sign in with a different Whop account, use the
other app, or wait a minute after a purchase. It shows your own account only,
and keeps nothing.
THE CHEESE BOARD · Handbook
6 · The two tiers (continued)
🔖 Your levels (CheeseAI+) are prices you mark yourself — a level
from your own chart, a round number you care about. Tap a strike on the
Heatmap for 🔖 Mark, or type any price into the Your levels row
under the Heatmap's tiles. Each one is drawn on every board that shows that
strike — a 🔖 on the Heatmap, the 0DTE ladder and Charcuterie, a fine dotted
line on the Price chart — and the row says how far it sits from spot, in points
and in that name's typical days, the gamma the scan carries there (or that the
scan doesn't reach it), and whether it is a wall or a king today. Up to six a
name and sixty in all, saved to your account so they follow you to every
device; Heat's Settings lists them all, to take one off or clear a name. When
price crosses one you get a push: within seconds while the live price is
flowing, otherwise by the next scan, in regular hours, inside your quiet hours and alert switches. They are your prices, not dealer levels — the
board does not treat them as either.
📄 Offering watch (CheeseAI+) reads the SEC's public filings for the
names on the board. When a company files to sell stock, its board shows a 📄
chip — beside the name, or in the SPOT tile on a phone — that opens the filings,
each linked to the SEC, and you get an alert (switch it off under 📄
Offerings in your alert settings). ATM on file means the company has
an at-the-market program: it may sell shares into the market over time, up to
the size shown, and the filing does not say it is selling today. Priced
and launched are deals, with the time they were filed; convertible notes
and private sales are listed too. The list also shows deals where existing holders
sell shares, marked “the company gets none of the money from these sales”, as the
filing states; those never make a chip or an alert, and only some kinds of filing
are read for them, so not every sale by holders is listed. A size shows only when
the filing states one; otherwise it says filed. Heat marks the panel and the tile, and Themes
counts the names with a program on file. Companies that report from abroad file
fewer forms here, so only their registered offerings show. A filing is a fact,
not a forecast.
Discord watch DMs (CheeseAI+, with Discord linked): /watch a
name and the bot DMs you when price crosses its MELT or breaks a wall — and
the names you star in the app count too. A level counts once price is clearly
through it, not while it sits on it; each name and level DMs you at most once
an hour, whichever way price goes next; and several names at once arrive as
one message. /unwatch stops a name, even one starred in the app (it
stays starred there), and /unwatch all stops every one; /watch a
name to hear about just that one again. Your app's alert settings — muted names, quiet hours, and the
MELT and wall switches — hold for these DMs as they do for your phone. Regular
hours only.
THE CHEESE BOARD · Handbook
6 · The two tiers (continued)
Discord commands. The bot answers privately: only you see the reply.
With CheeseAI+ and Discord linked: /levels and /board for a name;
/hot, short-gamma names and names nearest their MELT, ranked by
positioning; /market, VIX and how many names are long, short or balanced
gamma; /earnings; /picks, the open model ideas and the record as
counts by outcome beside random entries; /book, today's
Picture Book once it is ready after the close, or when it opens; and /vol,
VIX, the shape of its curve and how the board's options are priced against how
names have been moving (add a name for its own 30-day options against its
movement). On every tier, linked or not: /learn a word on the board, with
its page; /status, whether the levels are fresh and when the next update
is due; /access, Check my access; and /link, /unlink,
/unwatch and /help. On CheeseAI+, Settings › Account shows whether your
account is linked, since when, and what /link gives you. When a Cheese Stage
session is scheduled, More › Your day › Cheese Stage says when the next one starts, in your
time zone, and a tap opens the event in Discord.
The Discord briefs (with + Cheese Discord, either tier): premarket
from 7:00 AM ET, the opening bell once the levels are set, the hottest
names (each name's move measured against its own typical day) as one line in the alerts channel every hour from 10:00 AM until an hour before the close,
power hour, the names reporting tonight, and the closing recap — a weekly wrap
instead on the week's last session. Times are ET and slide with an early
close. On the evening before the week's first session (Sunday, or Monday when
Monday is a holiday) at 5:45 PM ET, the week's map: SPY's and QQQ's CHEDDAR,
MELT and BLUE from the last close, and
an image adding last week's and last month's ranges from SPY's and QQQ's own
regular-session bars. In the alerts channel, three times a day (9:15 AM, 12:00 PM and 3:15 PM
ET), the day's biggest gainers and biggest drops, one line each:
the names, their moves and their prices.
The Cheese Board (with + Cheese Discord, either tier) posts the
SPY, QQQ and IWM ladders every hour of the session, and carries a 🧀 Cheese
read of them: where each name's ♛ king sits against price (under it, over
it, or pinning right on it), whether it grew, shrank or moved
strike since the last hour, which side of MELT price is on and the gamma regime,
then one line for the three together. It is written from the same numbers as
the boards, says nothing when that data is not fresh, and is positioning, not a
signal.
If the options feed goes down. The boards fall back to a second data
source rather than going blank. The levels, cheese blocks, Market, Profile,
0DTE and Charcuterie all keep working; Activity, OI and max
pain need the deeper data and stay empty until the main feed is back. A banner
at the top says when this is happening and which names are affected — you will
never be shown fallback data as though nothing had changed.
THE CHEESE BOARD · Handbook
6 · The two tiers (continued)
The Price view (inside Profile). Open Profile and toggle to
Price: candles with today's levels drawn across them. It answers the
question the other views cannot: has price actually reached this wall before?
Pick the candle size at the top — 5m, 15m, 30m or 1H across the last few
sessions (regular hours only), or 1D for the long daily view. It handles
like a trading chart: drag or swipe sideways to pan, pinch (or Ctrl + scroll)
to zoom, drag an axis to stretch it, double-click to go back to the opening
view, and the crosshair's bar — its time in ET, open, high, low, close and
volume — reads out in the top-left corner. A plain scroll over the chart
still scrolls the page. Volume sits in its own pane underneath, and every
level is a line with its name and price on the axis. On the intraday sizes
the chart adds:
Dots along the strikes — dealer gamma at each strike through time,
from our own scans every 15 minutes (flip ⚡ GEX / 〰 VEX to see vanna
instead). A bigger dot is a bigger number; green is positive, violet
negative. The readout lists the biggest strikes at the bar under the
crosshair.
Node strips — past the last candle, each session ahead gets a band
at every big strike: the book still open that day, which is today's open
interest less the expiries that will have settled by then. Brighter is
bigger, green positive, violet negative, and the largest are labelled
strike — size as a share of the biggest on the chart. A relative size,
not odds — where positioning stands now, not where it will be. The strips drop the expiries that settle and leave the rest priced as today; the Level Clock also re-prices what is left, so its levels can differ from the strips' biggest nodes.
Volume by price — how much traded at each price across the bars on
screen, with its busiest price marked POC.
PDH / PDL — the prior session's high and low — and IB, this
session's opening range (its first thirty minutes).
Two fits — fit the levels, or zoom to the candles; a level outside a zoomed
range is marked with an arrow rather than drawn at a price it is not at. The walls and flip are today's, painted over older bars, so
treat the history as context rather than a record of what those bars traded
against — the dots are the part that shows what was there at the time. Candles
come from a separate price feed (the chain carries no history) and cover every
name we scan, indices included; a name you have just opened can take a moment
to fill in, and the dots build up over the first sessions after a name is
added.
aVWAP, the anchored VWAP. From each of the name's two most recent
major lows, the chart draws the average price paid since that low, weighted by
volume, and a dashed line one standard deviation below it: across the candles
on 1D, and as today's values on the intraday sizes, each named by its low's
date ("aVWAP · Mar 30 low") with its price on the axis. A major low is the
lowest price of the six months before it and the five weeks after it, reached
by a fall of at least 10% (more on a name that routinely swings further), so a
name with no such low in its two years of daily history has none. It is an
average, not a wall: price can trade through it. The aVWAP button above the
chart turns them off.
THE CHEESE BOARD · Handbook
6 · The two tiers (continued)
The priced range and the odds. The shaded band to the right of the
candles is the range the name's own options are pricing between now and
an expiry — the one that settles at the close the projection runs to when
there is one, otherwise the front expiry; on an expiry day, only the hours left
to that afternoon's close — drawn to the same time scale as the candles: the inner band roughly two
chances in three, the outer about nineteen in twenty. The percentage beside each
level is the market's priced chance of price touching it before that
expiry. Touch, not close: a level tagged and given back still counts. The fine
grey dashed lines are the range the tape has actually been moving over the last
few weeks, on the same scale. Those lines inside the band mean the tape has been
calmer than the options charge; outside it, wilder. Both bands grow the way
the sessions do: through the trading hours, still overnight and at the weekend.
All of it is what the market prices, not a forecast.
The projection. The one exception is labelled as such: the amber path
out of spot is the model's projected close for each session left this week,
ending in a ringed point with its price and its move from here. The first close
is the same number as the 0DTE projected close; each later one reads only the
options still open on that day, sized by the options' own move to then. Only
the closes are modelled — the path runs straight between them and flat while
the market is shut — and it stops short before an earnings report inside the
week. The faint amber fan is the model's likely range, its two ends labelled;
the shaded cyan band is still what the market prices. The row above the chart
switches it on and off and picks how far it runs — Today on a name with
a same-day expiry, To this week's last session, and the week after or a
later expiry where the book reaches that far — and says how many sessions it
covers and through when. It is a model projection, scored in public, not a
target: each week's path is locked in Monday's opening hours and every close is
graded, and no hit rate is shown until there are eight weeks and a hundred
name-weeks behind it.
THE CHEESE BOARD · Handbook
6 · The two tiers (continued)
SPY's Price view, 30-minute candles over the five sessions to Thu, Oct 22: the levels across them, the prior day's high and low (PDH, PDL), the opening range (IB), the busiest price (POC) and volume underneath; past the last candle, the range the options price to the Oct 23 close and the model's projected close (a projection, not a target). Max pain wasn't on file for this session, so its line is missing here. CheeseAI · real session, Thu, Oct 22, 2026, after the close.
VWAP, the week's lines and the dates. On the intraday sizes,
VWAP is the session's average price since the open, weighted by volume:
a line in the text colour that starts again at each open, its value on the axis
(the VWAP button turns it off). The Week button adds last week's and last
month's high and low (PWH/PWL, PMH/PML), this week's open and, once it has
closed, its first session's range: prices already traded, marked for reference,
not walls. Small tags along the foot of the chart mark dates: E where the
name reported and where it reports next, and the market's scheduled prints from
today on (CPI, FOMC, Jobs…); the readout names each with its time when known.
THE CHEESE BOARD · Handbook
7 · Getting help
Help in the app is where to start: More › Help or, on a computer, each
board's ⓘ About this board or ?. It holds Start here, the guide to the
board you're on (three Start here lines first, everything else on the
board folded under them, with a note on every part of it), the Legend for
every colour and mark, the words, this handbook, What's new, whether the data is
fresh, and feedback. §3's Finding your way says where everything lives.
On a phone the app sits in one frame. The bar at the top (the app menu,
the status pill, Easy and the version) and the bar at the bottom stay put while
boards, Heat, The Lab and Flow open between them, and Print Shop, the
Portfolio Manager and Compass too. The app opens on Home, every board,
app and everyday tool as a tile. The bottom bar is Home, the boards and
apps you pin (Settings › Boards, or Edit Home) and More; until you pin
your own, on CheeseAI+ your first two boards, 🔥 Heat and 🧪 The Lab
(Flow is on Home and in the app menu); turned sideways it holds every board you show.
On a name's board Ask Jack sits beside the name, where ‹ › step through
your names (a sideways swipe on the name does too). As you scroll down the name
row tucks under the top bar and comes back as soon as you scroll up. On
CheeseAI, The Lab sits in the bar with a 🔒, and the CheeseAI ▾ menu lists
Heat 🔒, The Lab 🔒, Flow 🔒, Print Shop 🔒, the Portfolio Manager 🔒 and Compass 🔒 under
With CheeseAI+, each showing what CheeseAI+ adds. Inside the frame there is one
More: Heat's, the Lab's and Flow's own rows are its This screen rows, each switch
saying where it stands (the Lab's Filter, How to read, Show as a table, Key,
Explain mode, Deep view, By expiry, Rates and credit, Trails and Motion; Flow's
Find a name, How to read, Projection and Flow), and Heat's settings row reads
Heat's settings. On the Sphere a small Sphere menu keeps Kiosk and
Turn by tilting. On a computer there is no bar at
the bottom: the top bar is one row, with Settings and More in words, and the
app menu at the brand opens the other apps, each on its own page.
Getting around. A tap opens the page it was about: a 🗓 earnings
badge opens that name's earnings read, PIN RISK the 0DTE board, NET GEX
the Heatmap, P/C the Options board, a dip its price chart, and a side-box
row the board its box is about. CHEDDAR, BLUE, MELT or MAX PAIN opens the
word; max pain's card has the 0DTE board a tap on. On a phone, a tap on an explanation (the earnings
card's "why not the print?", a grid's Net γ row) shows its words in a
small bubble; another tap or a scroll closes it. The ‹ button
at the top goes back to where you were — board, name and view — and on a
phone it names the board it goes back to; so does Backspace (and, in
the installed app, your phone's own Back). On a phone, swipe in from the left
edge to go back.
What's new lists every update ever shipped, newest first, and opens on
everything you haven't read; a gold dot on the version number (on More, where
the number has given way) means something shipped since you last looked.
Check my access, in Settings › Account, is for when a sign-in is
turned away or you are not sure which membership opens which app; and
Is the data fresh?, in Help, opens the public status page that says
whether the levels are fresh and every app is answering.
THE CHEESE BOARD · Handbook
7 · Getting help (continued)
Help › Send feedback reaches the developer directly, with the board you were
on attached for context. It also has a 📈 Ticker tab: put a symbol
forward, or add your vote to one already on the list. The list is ranked,
and the most-wanted names are the ones that go on the board next. Type a
company name and it will work out the symbol for you.
Alerts on your phone need to be switched on from CheeseAI in its
own browser tab — they cannot be started from inside an embedded window.
On iPhone, add CheeseAI to your Home Screen first, from Safari (the app
keeps the page size set under Safari's aA). If you added it before
Thu, Oct 15, 2026, remove it and add it again from Safari once: CheeseAI,
CheeseAI+ and Heat each get their own icon and launch screen, and the top
of the screen clears under the clock. You sign in once more and turn
alerts back on from the new icon. Once they are on, they
stay on — they are tied to your account, and if anything changes on our
side your device reconnects itself without asking you again.
Small text on an iPhone? That is the page zoomed out (Safari's
page zoom, which a Home Screen app keeps from the Safari it was added
from): a wider layout with smaller text, and a pinch zooms the page in,
except on a chart in the app or the Lab, the Lab's Sphere and its Map (in
Heat, anywhere). It is yours to
keep. A note offers Keep this size, kept for good in that app, or
Full size: the Home Screen app lays itself out at the phone's own
width; in a Safari tab, tap aA and choose 100%. Close the note and it
waits a week. Settings › Display › Page size (in Heat, its own Settings › Page size)
changes the choice later. If full size doesn't take, remove the app,
open the site in Safari at 100%, sign in and add it again. Heat and The
Lab offer the same choice and, opened from CheeseAI+, follow its answer;
while the app stays zoomed out, they open on their own full pages.
Fourteen palettes, thirteen of them living — from Dark and Midnight
through the grays Steel, Pewter and Stone and the bold Aurora, Nebula,
Ocean, Solar and Bloom, each with its own slow-drifting animated
background (only Contrast stays still). Slate is the mid-tone for
premarket and after hours; follow the market clock and the theme moves
between them. One theme in CheeseAI, CheeseAI+, Heat and The Lab
(CheeseAI+'s, if you have both), picked in Settings › Display: Dark,
Midnight, Steel and Contrast up front, all fourteen one tap further.
Settings — the Settings button in the top bar on a computer, More ›
Settings on a phone — opens on Alerts (this device, a test, your
devices, quiet hours, what else is sent to your phone and, on CheeseAI+, what
buzzes you), then Display (theme, density, the time zone: New York, ET,
unless you pick another; layout, side boxes, page size and More display
options, Everything open among them), Boards (your boards as one list to
drag or move with ↑ ↓, on CheeseAI+ a tap shows or hides one; the phone's bar;
the ticker tape) and Account (your plan, Check my access, the Store,
About & legal, Reset to defaults, Log out). It saves itself to your login,
so a new phone or browser opens the way you left it; Retry shows only if a
save did not get through.
Store, in Settings › Account, goes to Paul's Bota on Whop.